# Technology
# Server
# Huawei RH2288H v3
### Manually setting FAN speed
Usage: ipmcset -d fanmode -v <mode> \[timeout\]
Modes are:
0 auto regulate fan speed, without parameter \[timeout\]
1 manual regulate fan speed
without parameter \[timeout\], default timeout(30 seconds)
with parameter \[timeout\], timeout range <0-100000000>,(0 means max timeout)
Usage: ipmcset -d fanlevel -v <value> \[fanid\]
Note :
1.Set fan speed level for all fans, without parameter \[fanid\]
2.Set fan speed level for specific fan, with parameter \[fanid\]
\[fanid\] range <1-4>
```
ipmcset -d fanmode -v 1 0
ipmcset -d fanlevel -v 26
```
Manually setting the fan speed to 26% is sufficient in a controlled environment (22°C) and without GPUs.
# Fujitsu Eternus LT20 S2
### Password Recovery
If you lost your password for Administartor or User you may not reset the password with restoring factory defaults, as network and user settings stay in place.
You can login with Service User and the password "F.CE".
# NVIDIA Tesla GPU - Power Brake
```bash
nvidia-smi -q | grep HW
HW Slowdown : Active
HW Thermal Slowdown : Not Active
HW Power Brake Slowdown : Active
```
Your server vendor may block GPUs not on a HCL. HW Power Brake Slowdown on NVIDIA Tesla GPUs is documented with a fixed slowdown of 50% in performance and power limit (see Data Sheet).
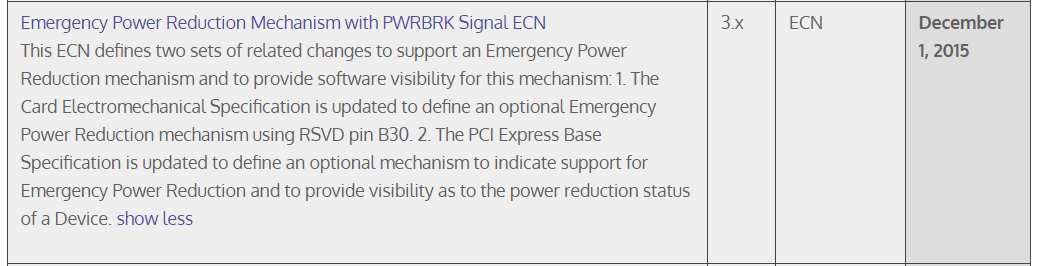
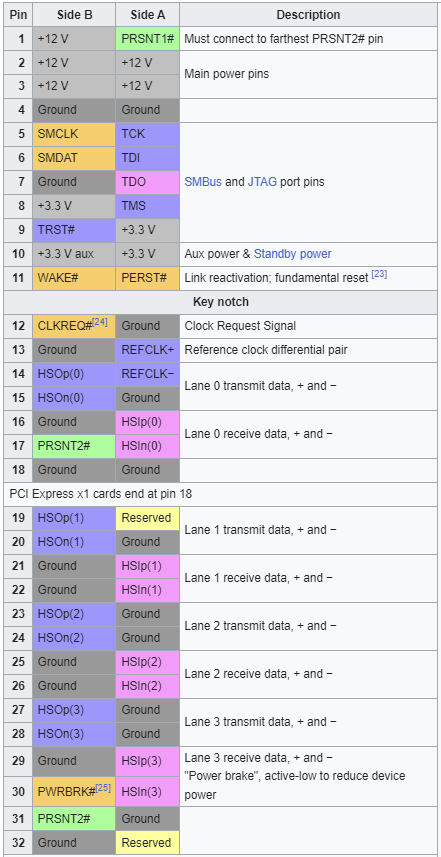
You can prevent the system from activating the "HW Power Brake" by blocking PCIe Pin B30. Pin B30 has been a reserved pin for long time. This has changed to Pin B30 being a PWRBRK for emergency power reduction.
[](https://wiki.isunreal.de/uploads/images/gallery/2024-04/6HxFsZRlBHdpq8CD-image.png)
Source: [https://pcisig.com/specifications/pciexpress/](https://pcisig.com/specifications/pciexpress/)
Tape or use a waterproof marker to block Pin B30. B30 is on the cooler side 30th Pin.
```bash
nvidia-smi -q | grep HW
HW Slowdown : Not Active
HW Thermal Slowdown : Not Active
HW Power Brake Slowdown : Not Active
```
[](https://wiki.isunreal.de/uploads/images/gallery/2024-04/GGYgmooGX8xgzMZW-image.png)
# SBC - Benchmarks
# VisionFive 2 - RISC-V - JH7110
Linux ArchVF2 6.12.18-cwt-5.14.0-2 #1 SMP PREEMPT\_DYNAMIC Tue Apr 8 17:15:39 +07 2025 riscv64 GNU/Linux
```bash
06.12.2025
sbc-bench v0.9.72
Installing needed tools: distro packages already installed. Done.
Checking cpufreq OPP. Done (results will be available in 10-16 minutes).
Executing tinymembench. Done.
Executing RAM latency tester. Done.
Executing OpenSSL benchmark. Done.
Executing 7-zip benchmark. Done.
Checking cpufreq OPP again. Done (12 minutes elapsed).
Results validation:
* Advertised vs. measured max CPU clockspeed: -1.3% before, -1.3% after -> https://tinyurl.com/32w9rr94
* No swapping
* Background activity (%system) OK
* No throttling
Memory performance
memcpy: 865.7 MB/s
memset: 772.2 MB/s
7-zip total scores (3 consecutive runs): 4240,4242,4245, single-threaded: 1232
OpenSSL results:
type 16 bytes 64 bytes 256 bytes 1024 bytes 8192 bytes 16384 bytes
aes-128-cbc 28765.81k 38883.61k 42767.96k 43852.80k 44127.57k 44034.73k
aes-128-cbc 28915.51k 38936.47k 42785.54k 43860.65k 44133.03k 44045.65k
aes-192-cbc 26072.98k 33627.39k 36439.38k 37218.65k 37410.13k 37350.06k
aes-192-cbc 25876.20k 33591.68k 36442.11k 37213.18k 37415.59k 37360.98k
aes-256-cbc 23460.88k 29573.44k 31747.93k 32316.07k 32489.47k 32402.09k
aes-256-cbc 23408.30k 29574.68k 31744.85k 32339.97k 32489.47k 32434.86k
```
Full Result
sbc-bench v0.9.72 StarFive VisionFive 2 v1.3B (Sat, 06 Dec 2025 20:29:51 +0000)
Description: Arch Linux
/usr/sbin/gcc (GCC) 15.2.1 20250813
Uptime: 20:29:51 up 44 min, 1 user, load average: 1.06, 2.20, 1.70, 33.1°C, 319744133
Linux 6.12.18-cwt-5.14.0-2 (ArchVF2) 12/06/25 \_riscv64\_ (4 CPU)
avg-cpu: %user %nice %system %iowait %steal %idle
21.51 0.01 1.83 0.77 0.00 75.87
Device tps kB\_read/s kB\_wrtn/s kB\_dscd/s kB\_read kB\_wrtn kB\_dscd
mmcblk1 3.93 69.36 273.31 8.44 185584 731304 22592
zram0 0.03 0.54 0.00 0.00 1432 4 0
total used free shared buff/cache available
Mem: 3.8Gi 319Mi 3.5Gi 1.7Mi 105Mi 3.5Gi
Swap: 1.9Gi 0B 1.9Gi
Filename Type Size Used Priority
/dev/zram0 partition 1979388 0 100
WARNING: ZSWAP ON TOP OF ZRAM HAS BEEN CONFIGURED ON THIS SYSTEM!
THIS WILL SEVERELY HARM PERFORMANCE IN CASE SWAPPING OCCURS!
Zswap active using zstd/zsmalloc, max pool occupation: 20%, details:
pool\_limit\_hit:0
pool\_total\_size:0
reject\_alloc\_fail:0
reject\_compress\_fail:0
reject\_compress\_poor:0
reject\_kmemcache\_fail:0
reject\_reclaim\_fail:0
stored\_pages:0
written\_back\_pages:0
\##########################################################################
Checking cpufreq OPP (sifive,u74-mc):
Cpufreq OPP: 1500 Measured: 1481 (1481.241/1481.207/1481.190) (-1.3%)
Cpufreq OPP: 1250 Measured: 730 (731.128/730.986/730.360) (-41.6%)
Cpufreq OPP: 750 Measured: 730 (731.253/730.727/730.368) (-2.7%)
Cpufreq OPP: 625 Measured: 481 (482.300/481.963/480.735) (-23.0%)
Cpufreq OPP: 500 Measured: 481 (482.311/481.916/481.568) (-3.8%)
Cpufreq OPP: 417 Measured: 356 (356.625/356.582/356.304) (-14.6%)
Cpufreq OPP: 375 Measured: 356 (357.330/357.059/356.351) (-5.1%)
Cpufreq OPP: 312 Measured: 281 (282.387/281.830/281.585) (-9.9%)
\##########################################################################
Hardware sensors:
sfctemp-isa-120e0000
temp1: +31.0 C
\##########################################################################
Executing benchmark on cpu0 (sifive,u74-mc):
tinymembench v0.4.9-nuumio (simple benchmark for memory throughput and latency)
CFLAGS:
bandwidth test min repeats (-b): 2
bandwidth test max repeats (-B): 3
bandwidth test mem realloc (-M): no (-m for realloc)
latency test repeats (-l): 3
latency test count (-c): 1000000
==========================================================================
== Memory bandwidth tests ==
== ==
== Note 1: 1MB = 1000000 bytes ==
== Note 2: Test result is the best of repeated runs. Number of repeats ==
== is shown in brackets ==
== Note 3: Results for 'copy' tests show how many bytes can be ==
== copied per second (adding together read and writen ==
== bytes would have provided twice higher numbers) ==
== Note 4: 2-pass copy means that we are using a small temporary buffer ==
== to first fetch data into it, and only then write it to the ==
== destination (source -> L1 cache, L1 cache -> destination) ==
== Note 5: If sample standard deviation exceeds 0.1%, it is shown in ==
== brackets ==
==========================================================================
C copy backwards : 884.4 MB/s (3, 2.3%)
C copy backwards (32 byte blocks) : 884.3 MB/s (2)
C copy backwards (64 byte blocks) : 885.6 MB/s (3, 0.1%)
C copy : 882.8 MB/s (2)
C copy prefetched (32 bytes step) : 883.3 MB/s (2)
C copy prefetched (64 bytes step) : 883.7 MB/s (3)
C 2-pass copy : 855.7 MB/s (3)
C 2-pass copy prefetched (32 bytes step) : 853.3 MB/s (2)
C 2-pass copy prefetched (64 bytes step) : 853.6 MB/s (2)
C scan 8 : 600.0 MB/s (3, 1.1%)
C scan 16 : 987.6 MB/s (3, 3.2%)
C scan 32 : 840.3 MB/s (3, 1.4%)
C scan 64 : 1850.5 MB/s (3, 0.2%)
C fill : 771.4 MB/s (3, 0.3%)
C fill (shuffle within 16 byte blocks) : 777.2 MB/s (3, 0.4%)
C fill (shuffle within 32 byte blocks) : 770.8 MB/s (3, 0.3%)
C fill (shuffle within 64 byte blocks) : 774.0 MB/s (3, 0.4%)
\---
libc memcpy copy : 865.7 MB/s (3, 0.4%)
libc memchr scan : 1358.9 MB/s (2)
libc memset fill : 772.2 MB/s (2)
==========================================================================
== Memory latency test ==
== ==
== Average time is measured for random memory accesses in the buffers ==
== of different sizes. The larger is the buffer, the more significant ==
== are relative contributions of TLB, L1/L2 cache misses and SDRAM ==
== accesses. For extremely large buffer sizes we are expecting to see ==
== page table walk with several requests to SDRAM for almost every ==
== memory access (though 64MiB is not nearly large enough to experience ==
== this effect to its fullest). ==
== ==
== Note 1: All the numbers are representing extra time, which needs to ==
== be added to L1 cache latency. The cycle timings for L1 cache ==
== latency can be usually found in the processor documentation. ==
== Note 2: Dual random read means that we are simultaneously performing ==
== two independent memory accesses at a time. In the case if ==
== the memory subsystem can't handle multiple outstanding ==
== requests, dual random read has the same timings as two ==
== single reads performed one after another. ==
==========================================================================
block size : single random read / dual random read, \[MADV\_NOHUGEPAGE\]
1024 : 0.0 ns / 0.0 ns
2048 : 0.0 ns / 0.0 ns
4096 : 0.0 ns / 0.0 ns
8192 : 0.0 ns / 0.0 ns
16384 : 0.1 ns / 0.0 ns
32768 : 0.2 ns / 0.1 ns
65536 : 5.9 ns / 10.7 ns
131072 : 8.9 ns / 16.0 ns
262144 : 10.7 ns / 18.6 ns
524288 : 16.1 ns / 29.5 ns
1048576 : 19.1 ns / 31.1 ns
2097152 : 38.4 ns / 62.5 ns
4194304 : 86.7 ns / 170.4 ns
8388608 : 126.1 ns / 248.2 ns
16777216 : 146.8 ns / 292.0 ns
33554432 : 161.0 ns / 319.5 ns
67108864 : 171.1 ns / 340.8 ns
block size : single random read / dual random read, \[MADV\_HUGEPAGE\]
1024 : 0.0 ns / 0.0 ns
2048 : 0.0 ns / 0.0 ns
4096 : 0.0 ns / 0.0 ns
8192 : 0.0 ns / 0.0 ns
16384 : 0.1 ns / 0.0 ns
32768 : 0.2 ns / 0.1 ns
65536 : 5.8 ns / 10.7 ns
131072 : 8.9 ns / 16.0 ns
262144 : 10.6 ns / 18.6 ns
524288 : 12.0 ns / 19.9 ns
1048576 : 14.0 ns / 20.5 ns
2097152 : 26.4 ns / 26.8 ns
4194304 : 80.8 ns / 158.7 ns
8388608 : 115.3 ns / 226.1 ns
16777216 : 130.9 ns / 260.1 ns
33554432 : 143.4 ns / 284.7 ns
67108864 : 149.4 ns / 297.1 ns
\##########################################################################
Executing ramlat on cpu0 (sifive,u74-mc), results in ns:
size: 1x32 2x32 1x64 2x64 1xPTR 2xPTR 4xPTR 8xPTR
4k: 2.832 2.908 2.735 2.793 2.026 2.027 2.789 5.658
8k: 2.787 2.872 2.703 2.789 2.027 2.027 2.787 5.660
16k: 2.793 2.884 2.712 2.790 2.030 2.032 2.790 5.666
32k: 2.807 2.895 2.723 2.807 2.042 2.042 2.809 5.706
64k: 13.76 24.48 13.58 24.41 13.54 24.41 48.85 97.74
128k: 13.68 24.46 13.58 24.39 13.54 24.45 48.85 99.07
256k: 13.67 24.45 13.60 24.37 13.54 24.42 48.84 97.82
512k: 13.68 24.47 13.57 24.38 13.55 24.42 51.75 97.78
1024k: 13.72 24.53 13.58 24.38 13.54 24.41 48.85 97.71
2048k: 19.78 34.02 18.48 34.65 26.93 34.34 66.61 126.6
4096k: 131.2 236.2 130.5 236.2 130.4 235.7 437.4 848.9
8192k: 157.6 273.8 157.5 274.0 157.4 273.7 514.7 984.3
16384k: 160.8 277.2 160.7 276.9 160.9 279.9 515.5 996.0
32768k: 169.0 287.2 169.1 289.9 168.9 286.8 531.6 1014
65536k: 169.7 287.3 169.1 287.4 169.1 286.7 531.6 1017
131072k: 169.0 287.4 169.0 287.4 169.0 286.6 531.3 1014
\##########################################################################
Executing benchmark twice on cluster 0 (sifive,u74-mc)
OpenSSL 3.6.0, built on 1 Oct 2025 (Library: OpenSSL 3.6.0 1 Oct 2025)
type 16 bytes 64 bytes 256 bytes 1024 bytes 8192 bytes 16384 bytes
aes-128-cbc 28765.81k 38883.61k 42767.96k 43852.80k 44127.57k 44034.73k
aes-128-cbc 28915.51k 38936.47k 42785.54k 43860.65k 44133.03k 44045.65k
aes-192-cbc 26072.98k 33627.39k 36439.38k 37218.65k 37410.13k 37350.06k
aes-192-cbc 25876.20k 33591.68k 36442.11k 37213.18k 37415.59k 37360.98k
aes-256-cbc 23460.88k 29573.44k 31747.93k 32316.07k 32489.47k 32402.09k
aes-256-cbc 23408.30k 29574.68k 31744.85k 32339.97k 32489.47k 32434.86k
\##########################################################################
Executing benchmark single-threaded on cpu0 (sifive,u74-mc)
7-Zip (a) 16.02 : Copyright (c) 1999-2016 Igor Pavlov : 2016-05-21
p7zip Version 16.02 (locale=C,Utf16=off,HugeFiles=on,64 bits,4 CPUs LE)
LE
CPU Freq: 64000000 64000000 64000000 64000000 128000000 256000000 512000000 - 2048000000
RAM size: 3866 MB, # CPU hardware threads: 4
RAM usage: 435 MB, # Benchmark threads: 1
Compressing | Decompressing
Dict Speed Usage R/U Rating | Speed Usage R/U Rating
KiB/s % MIPS MIPS | KiB/s % MIPS MIPS
22: 973 98 966 947 | 17438 98 1514 1489
23: 942 98 980 961 | 17098 98 1505 1480
24: 925 98 1015 995 | 16766 98 1497 1472
25: 912 98 1063 1042 | 16493 98 1493 1468
\---------------------------------- | ------------------------------
Avr: 98 1006 986 | 98 1502 1477
Tot: 98 1254 1232
\##########################################################################
Executing benchmark 3 times multi-threaded on CPUs 0-3
7-Zip (a) 16.02 : Copyright (c) 1999-2016 Igor Pavlov : 2016-05-21
p7zip Version 16.02 (locale=C,Utf16=off,HugeFiles=on,64 bits,4 CPUs LE)
LE
CPU Freq: 64000000 - 64000000 - 128000000 - 512000000 1024000000 2048000000
RAM size: 3866 MB, # CPU hardware threads: 4
RAM usage: 882 MB, # Benchmark threads: 4
Compressing | Decompressing
Dict Speed Usage R/U Rating | Speed Usage R/U Rating
KiB/s % MIPS MIPS | KiB/s % MIPS MIPS
22: 2668 318 816 2596 | 67385 391 1471 5749
23: 2634 323 830 2684 | 66415 392 1464 5747
24: 2609 326 861 2806 | 64984 392 1456 5705
25: 2588 328 902 2955 | 63840 393 1447 5682
\---------------------------------- | ------------------------------
Avr: 324 852 2760 | 392 1460 5721
Tot: 358 1156 4240
7-Zip (a) 16.02 : Copyright (c) 1999-2016 Igor Pavlov : 2016-05-21
p7zip Version 16.02 (locale=C,Utf16=off,HugeFiles=on,64 bits,4 CPUs LE)
LE
CPU Freq: 64000000 - - 64000000 - - - - -
RAM size: 3866 MB, # CPU hardware threads: 4
RAM usage: 882 MB, # Benchmark threads: 4
Compressing | Decompressing
Dict Speed Usage R/U Rating | Speed Usage R/U Rating
KiB/s % MIPS MIPS | KiB/s % MIPS MIPS
22: 2674 318 818 2602 | 67600 393 1469 5767
23: 2630 323 829 2680 | 66425 393 1463 5747
24: 2608 326 861 2805 | 64876 392 1454 5695
25: 2593 328 902 2961 | 63776 393 1445 5676
\---------------------------------- | ------------------------------
Avr: 324 852 2762 | 393 1458 5722
Tot: 358 1155 4242
7-Zip (a) 16.02 : Copyright (c) 1999-2016 Igor Pavlov : 2016-05-21
p7zip Version 16.02 (locale=C,Utf16=off,HugeFiles=on,64 bits,4 CPUs LE)
LE
CPU Freq: - 64000000 - - - - - - -
RAM size: 3866 MB, # CPU hardware threads: 4
RAM usage: 882 MB, # Benchmark threads: 4
Compressing | Decompressing
Dict Speed Usage R/U Rating | Speed Usage R/U Rating
KiB/s % MIPS MIPS | KiB/s % MIPS MIPS
22: 2668 317 818 2596 | 67632 392 1470 5770
23: 2642 324 830 2692 | 66340 392 1463 5740
24: 2619 327 861 2816 | 65095 393 1455 5714
25: 2593 329 901 2961 | 63710 393 1444 5670
\---------------------------------- | ------------------------------
Avr: 324 853 2766 | 393 1458 5724
Tot: 358 1155 4245
Compression: 2760,2762,2766
Decompression: 5721,5722,5724
Total: 4240,4242,4245
\##########################################################################
Testing maximum cpufreq again, still under full load. System health now:
Time CPU load %cpu %sys %usr %nice %io %irq Temp
20:40:47: 1500MHz 4.29 79% 1% 76% 0% 0% 2% 36.3°C
Checking cpufreq OPP (sifive,u74-mc):
Cpufreq OPP: 1500 Measured: 1481 (1481.156/1481.070/1480.916) (-1.3%)
\##########################################################################
Hardware sensors:
sfctemp-isa-120e0000
temp1: +35.2 C
\##########################################################################
Thermal source: /sys/devices/virtual/thermal/thermal\_zone0/ (cpu-thermal)
System health while running tinymembench:
Time CPU load %cpu %sys %usr %nice %io %irq Temp
20:30:34: 1500MHz 1.03 24% 1% 21% 0% 0% 0% 32.5°C
20:30:44: 1500MHz 1.03 25% 0% 24% 0% 0% 0% 33.7°C
20:30:55: 1500MHz 1.02 25% 0% 24% 0% 0% 0% 33.8°C
20:31:05: 1500MHz 1.02 25% 0% 24% 0% 0% 0% 34.0°C
20:31:15: 1500MHz 1.01 25% 0% 24% 0% 0% 0% 33.6°C
20:31:25: 1500MHz 1.01 25% 0% 24% 0% 0% 0% 33.4°C
System health while running ramlat:
Time CPU load %cpu %sys %usr %nice %io %irq Temp
20:31:27: 1500MHz 1.01 24% 1% 21% 0% 0% 0% 33.8°C
20:31:30: 1500MHz 1.01 25% 0% 24% 0% 0% 0% 33.5°C
20:31:33: 1500MHz 1.01 25% 0% 24% 0% 0% 0% 33.6°C
20:31:36: 1500MHz 1.01 25% 0% 24% 0% 0% 0% 33.6°C
20:31:40: 1500MHz 1.01 25% 0% 24% 0% 0% 0% 33.7°C
20:31:43: 1500MHz 1.01 25% 0% 24% 0% 0% 0% 33.7°C
20:31:46: 1500MHz 1.01 25% 0% 24% 0% 0% 0% 33.6°C
20:31:49: 1500MHz 1.01 25% 0% 24% 0% 0% 0% 33.5°C
20:31:52: 1500MHz 1.01 25% 0% 24% 0% 0% 0% 33.5°C
20:31:55: 1500MHz 1.01 25% 0% 24% 0% 0% 0% 33.5°C
20:31:58: 1500MHz 1.00 25% 0% 24% 0% 0% 0% 33.5°C
20:32:01: 1500MHz 1.00 25% 0% 24% 0% 0% 0% 33.5°C
20:32:04: 1500MHz 1.00 25% 1% 23% 0% 0% 0% 33.6°C
System health while running OpenSSL benchmark:
Time CPU load %cpu %sys %usr %nice %io %irq Temp
20:32:08: 1500MHz 1.00 24% 1% 21% 0% 0% 0% 33.9°C
20:32:24: 1500MHz 1.00 25% 0% 24% 0% 0% 0% 33.9°C
20:32:40: 1500MHz 1.00 25% 0% 24% 0% 0% 0% 33.9°C
20:32:56: 1500MHz 1.00 25% 0% 24% 0% 0% 0% 34.0°C
20:33:12: 1500MHz 1.00 25% 0% 24% 0% 0% 0% 34.1°C
20:33:28: 1500MHz 1.00 25% 0% 24% 0% 0% 0% 34.1°C
20:33:44: 1500MHz 1.00 25% 0% 24% 0% 0% 0% 34.1°C
System health while running 7-zip single core benchmark:
Time CPU load %cpu %sys %usr %nice %io %irq Temp
20:33:56: 1500MHz 1.00 24% 1% 21% 0% 0% 0% 34.3°C
20:34:06: 1500MHz 1.00 25% 0% 24% 0% 0% 0% 34.0°C
20:34:16: 1500MHz 1.00 25% 0% 24% 0% 0% 0% 33.9°C
20:34:26: 1500MHz 1.00 25% 0% 24% 0% 0% 0% 33.9°C
20:34:36: 1500MHz 1.00 25% 0% 24% 0% 0% 0% 33.9°C
20:34:46: 1500MHz 1.00 25% 0% 24% 0% 0% 0% 33.9°C
20:34:56: 1500MHz 1.00 25% 0% 24% 0% 0% 0% 33.9°C
20:35:07: 1500MHz 1.00 25% 0% 24% 0% 0% 0% 33.9°C
20:35:17: 1500MHz 1.00 25% 0% 24% 0% 0% 0% 34.0°C
20:35:27: 1500MHz 1.00 25% 0% 24% 0% 0% 0% 33.9°C
20:35:37: 1500MHz 1.00 25% 0% 24% 0% 0% 0% 33.9°C
20:35:47: 1500MHz 1.00 25% 0% 24% 0% 0% 0% 33.9°C
20:35:57: 1500MHz 1.00 25% 0% 24% 0% 0% 0% 33.9°C
System health while running 7-zip multi core benchmark:
Time CPU load %cpu %sys %usr %nice %io %irq Temp
20:35:59: 1500MHz 1.00 24% 1% 21% 0% 0% 0% 34.1°C
20:36:21: 1500MHz 1.78 84% 0% 82% 0% 0% 1% 36.1°C
20:36:41: 1500MHz 2.41 91% 0% 88% 0% 0% 1% 36.1°C
20:37:04: 1500MHz 2.89 90% 0% 87% 0% 0% 2% 36.5°C
20:37:24: 1500MHz 3.09 81% 1% 77% 0% 0% 2% 36.1°C
20:37:44: 1500MHz 3.41 92% 1% 89% 0% 0% 2% 36.4°C
20:38:05: 1500MHz 3.52 91% 0% 88% 0% 0% 1% 36.5°C
20:38:25: 1500MHz 3.65 91% 0% 88% 0% 0% 1% 36.5°C
20:38:46: 1500MHz 3.83 93% 0% 90% 0% 0% 2% 36.8°C
20:39:06: 1500MHz 3.71 80% 1% 76% 0% 0% 2% 36.2°C
20:39:26: 1500MHz 3.92 92% 1% 89% 0% 0% 2% 36.4°C
20:39:47: 1500MHz 3.89 91% 0% 89% 0% 0% 1% 36.5°C
20:40:07: 1500MHz 3.92 91% 0% 88% 0% 0% 1% 36.4°C
20:40:27: 1500MHz 4.01 93% 0% 90% 0% 0% 1% 36.8°C
20:40:47: 1500MHz 4.29 79% 1% 76% 0% 0% 2% 36.3°C
\##########################################################################
Linux 6.12.18-cwt-5.14.0-2 (ArchVF2) 12/06/25 \_riscv64\_ (4 CPU)
avg-cpu: %user %nice %system %iowait %steal %idle
27.73 0.02 1.86 0.62 0.00 69.77
Device tps kB\_read/s kB\_wrtn/s kB\_dscd/s kB\_read kB\_wrtn kB\_dscd
mmcblk1 3.20 58.55 218.72 6.74 196336 733460 22592
zram0 0.03 0.43 0.00 0.00 1432 4 0
total used free shared buff/cache available
Mem: 3.8Gi 326Mi 3.5Gi 1.8Mi 119Mi 3.5Gi
Swap: 1.9Gi 0B 1.9Gi
Filename Type Size Used Priority
/dev/zram0 partition 1979388 0 100
WARNING: ZSWAP ON TOP OF ZRAM HAS BEEN CONFIGURED ON THIS SYSTEM!
THIS WILL SEVERELY HARM PERFORMANCE IN CASE SWAPPING OCCURS!
Zswap active using zstd/zsmalloc, max pool occupation: 20%, details:
pool\_limit\_hit:0
pool\_total\_size:0
reject\_alloc\_fail:0
reject\_compress\_fail:0
reject\_compress\_poor:0
reject\_kmemcache\_fail:0
reject\_reclaim\_fail:0
stored\_pages:0
written\_back\_pages:0
CPU sysfs topology (clusters, cpufreq members, clockspeeds)
cpufreq min max
CPU cluster policy speed speed core type
0 0 0 312 1500 sifive,u74-mc
1 0 0 312 1500 sifive,u74-mc
2 0 0 312 1500 sifive,u74-mc
3 0 0 312 1500 sifive,u74-mc
Architecture: riscv64
Byte Order: Little Endian
CPU(s): 4
On-line CPU(s) list: 0-3
Vendor ID: 0x489
Model name: sifive,u74-mc
CPU family: 0x8000000000000007
Model: 0x4210427
Thread(s) per core: 1
Core(s) per socket: 4
Socket(s): 1
CPU(s) scaling MHz: 100%
CPU max MHz: 1500.0000
CPU min MHz: 312.5000
L1d cache: 128 KiB (4 instances)
L1i cache: 128 KiB (4 instances)
L2 cache: 2 MiB (1 instance)
Vulnerability Gather data sampling: Not affected
Vulnerability Itlb multihit: Not affected
Vulnerability L1tf: Not affected
Vulnerability Mds: Not affected
Vulnerability Meltdown: Not affected
Vulnerability Mmio stale data: Not affected
Vulnerability Reg file data sampling: Not affected
Vulnerability Retbleed: Not affected
Vulnerability Spec rstack overflow: Not affected
Vulnerability Spec store bypass: Not affected
Vulnerability Spectre v1: Not affected
Vulnerability Spectre v2: Not affected
Vulnerability Srbds: Not affected
Vulnerability Tsx async abort: Not affected
SoC guess: StarFive JH7110
DT compat: starfive,visionfive-2-v1.3b
starfive,jh7110
Compiler: /usr/sbin/gcc (GCC) 15.2.1 20250813 / riscv64-unknown-linux-gnu
Userland: riscv64
Kernel: 6.12.18-cwt-5.14.0-2/riscv64
CONFIG\_HZ=1000
CONFIG\_HZ\_1000=y
CONFIG\_PREEMPTION=y
CONFIG\_PREEMPT=y
CONFIG\_PREEMPT\_BUILD=y
CONFIG\_PREEMPT\_COUNT=y
CONFIG\_PREEMPT\_DYNAMIC=y
CONFIG\_PREEMPT\_RCU=y
\##########################################################################
cpu0/index0: 32K, level: 1, type: Instruction
cpu0/index1: 32K, level: 1, type: Data
cpu0/index2: 2048K, level: 2, type: Unified
cpu1/index0: 32K, level: 1, type: Instruction
cpu1/index1: 32K, level: 1, type: Data
cpu1/index2: 2048K, level: 2, type: Unified
cpu2/index0: 32K, level: 1, type: Instruction
cpu2/index1: 32K, level: 1, type: Data
cpu2/index2: 2048K, level: 2, type: Unified
cpu3/index0: 32K, level: 1, type: Instruction
cpu3/index1: 32K, level: 1, type: Data
cpu3/index2: 2048K, level: 2, type: Unified
\##########################################################################
cpusldo: 700 mV (0 mV max)
vdd-cpu: 1040 mV (1540 mV max)
opp-table-0:
312 MHz 900.0 mV
375 MHz 900.0 mV
417 MHz 900.0 mV
500 MHz 900.0 mV
625 MHz 900.0 mV
750 MHz 900.0 mV
1250 MHz 1000.0 mV
1500 MHz 1040.0 mV
\##########################################################################
Results validation:
\* Advertised vs. measured max CPU clockspeed: -1.3% before, -1.3% after -> https://tinyurl.com/32w9rr94
\* No swapping
\* Background activity (%system) OK
\* No throttling
| StarFive VisionFive 2 v1.3B | 1500 MHz | 6.12 | Arch Linux riscv64 | 4240 | 1232 | 32420 | 870 | 770 | - | |
Full Result
sbc-bench v0.9.67 StarFive VisionFive 2 v1.3B (Mon, 16 Sep 2024 23:12:43 +0000)
Description: Arch Linux
/usr/sbin/gcc (GCC) 14.2.1 20240910
Uptime: 23:12:43 up 23 min, 2 users, load average: 0.08, 1.03, 1.28, 37.2°C, 333476070
Linux 6.6.20-cwt-5.12.0-3 (starfive) 09/16/24 _riscv64_ (4 CPU)
avg-cpu: %user %nice %system %iowait %steal %idle
37.71 0.02 2.36 1.43 0.00 58.48
Device tps kB_read/s kB_wrtn/s kB_dscd/s kB_read kB_wrtn kB_dscd
mmcblk1 4.52 120.13 412.08 5.46 170316 584232 7740
zram0 0.04 0.83 0.00 0.00 1180 4 0
total used free shared buff/cache available
Mem: 3.8Gi 275Mi 3.5Gi 1.7Mi 93Mi 3.5Gi
Swap: 1.9Gi 0B 1.9Gi
Filename Type Size Used Priority
/dev/zram0 partition 1978364 0 100
WARNING: ZSWAP ON TOP OF ZRAM HAS BEEN CONFIGURED ON THIS SYSTEM!
THIS WILL SEVERELY HARM PERFORMANCE IN CASE SWAPPING OCCURS!
Zswap active using zstd/zsmalloc, max pool occupation: 20%, details:
duplicate_entry:0
pool_limit_hit:0
pool_total_size:0
reject_alloc_fail:0
reject_compress_poor:0
reject_kmemcache_fail:0
reject_reclaim_fail:0
same_filled_pages:0
stored_pages:0
written_back_pages:0
\##########################################################################
Checking cpufreq OPP (sifive,u74-mc):
Cpufreq OPP: 1500 Measured: 1486 (1486.657/1486.600/1486.278)
Cpufreq OPP: 1250 Measured: 736 (736.693/736.627/736.571) (-41.1%)
Cpufreq OPP: 750 Measured: 736 (737.071/737.033/736.883) (-1.9%)
Cpufreq OPP: 625 Measured: 487 (487.233/487.146/487.122) (-22.1%)
Cpufreq OPP: 500 Measured: 487 (487.249/487.162/487.068) (-2.6%)
Cpufreq OPP: 417 Measured: 362 (362.085/362.066/361.950) (-13.2%)
Cpufreq OPP: 375 Measured: 362 (362.264/362.199/362.158) (-3.5%)
Cpufreq OPP: 312 Measured: 287 (287.355/287.322/287.278) (-8.0%)
\##########################################################################
Hardware sensors:
sfctemp-isa-0000
temp1: +35.7 C
\##########################################################################
Executing benchmark on cpu0 (sifive,u74-mc):
tinymembench v0.4.9-nuumio (simple benchmark for memory throughput and latency)
CFLAGS:
bandwidth test min repeats (-b): 2
bandwidth test max repeats (-B): 3
bandwidth test mem realloc (-M): no (-m for realloc)
latency test repeats (-l): 3
latency test count (-c): 1000000
==========================================================================
== Memory bandwidth tests ==
== ==
== Note 1: 1MB = 1000000 bytes ==
== Note 2: Test result is the best of repeated runs. Number of repeats ==
== is shown in brackets ==
== Note 3: Results for 'copy' tests show how many bytes can be ==
== copied per second (adding together read and writen ==
== bytes would have provided twice higher numbers) ==
== Note 4: 2-pass copy means that we are using a small temporary buffer ==
== to first fetch data into it, and only then write it to the ==
== destination (source -> L1 cache, L1 cache -> destination) ==
== Note 5: If sample standard deviation exceeds 0.1%, it is shown in ==
== brackets ==
==========================================================================
C copy backwards : 1113.5 MB/s (3, 3.7%)
C copy backwards (32 byte blocks) : 1101.1 MB/s (2)
C copy backwards (64 byte blocks) : 1103.3 MB/s (2)
C copy : 1087.4 MB/s (3, 0.4%)
C copy prefetched (32 bytes step) : 1065.1 MB/s (3, 0.2%)
C copy prefetched (64 bytes step) : 1068.2 MB/s (2)
C 2-pass copy : 817.3 MB/s (3, 0.4%)
C 2-pass copy prefetched (32 bytes step) : 838.6 MB/s (3, 0.5%)
C 2-pass copy prefetched (64 bytes step) : 829.7 MB/s (3, 0.5%)
C scan 8 : 587.5 MB/s (2)
C scan 16 : 974.4 MB/s (3, 2.5%)
C scan 32 : 832.9 MB/s (3, 1.0%)
C scan 64 : 2095.9 MB/s (2)
C fill : 782.8 MB/s (3, 0.5%)
C fill (shuffle within 16 byte blocks) : 961.4 MB/s (3, 10.7%)
C fill (shuffle within 32 byte blocks) : 776.3 MB/s (2)
C fill (shuffle within 64 byte blocks) : 780.1 MB/s (3, 0.3%)
---
libc memcpy copy : 1057.5 MB/s (2)
libc memchr scan : 1367.3 MB/s (2)
libc memset fill : 782.1 MB/s (3, 0.3%)
==========================================================================
== Memory latency test ==
== ==
== Average time is measured for random memory accesses in the buffers ==
== of different sizes. The larger is the buffer, the more significant ==
== are relative contributions of TLB, L1/L2 cache misses and SDRAM ==
== accesses. For extremely large buffer sizes we are expecting to see ==
== page table walk with several requests to SDRAM for almost every ==
== memory access (though 64MiB is not nearly large enough to experience ==
== this effect to its fullest). ==
== ==
== Note 1: All the numbers are representing extra time, which needs to ==
== be added to L1 cache latency. The cycle timings for L1 cache ==
== latency can be usually found in the processor documentation. ==
== Note 2: Dual random read means that we are simultaneously performing ==
== two independent memory accesses at a time. In the case if ==
== the memory subsystem can't handle multiple outstanding ==
== requests, dual random read has the same timings as two ==
== single reads performed one after another. ==
==========================================================================
block size : single random read / dual random read, [MADV_NOHUGEPAGE]
1024 : 0.0 ns / 0.0 ns
2048 : 0.0 ns / 0.0 ns
4096 : 0.0 ns / 0.0 ns
8192 : 0.0 ns / 0.0 ns
16384 : 0.0 ns / 0.0 ns
32768 : 0.2 ns / 0.1 ns
65536 : 5.8 ns / 10.7 ns
131072 : 8.8 ns / 16.0 ns
262144 : 10.6 ns / 18.6 ns
524288 : 16.3 ns / 29.4 ns
1048576 : 19.1 ns / 31.6 ns
2097152 : 36.6 ns / 58.6 ns
4194304 : 86.7 ns / 170.6 ns
8388608 : 125.2 ns / 246.8 ns
16777216 : 146.5 ns / 290.5 ns
33554432 : 160.1 ns / 318.2 ns
67108864 : 170.6 ns / 339.4 ns
block size : single random read / dual random read, [MADV_HUGEPAGE]
1024 : 0.0 ns / 0.0 ns
2048 : 0.0 ns / 0.0 ns
4096 : 0.0 ns / 0.0 ns
8192 : 0.0 ns / 0.0 ns
16384 : 0.1 ns / 0.0 ns
32768 : 0.2 ns / 0.1 ns
65536 : 5.8 ns / 10.7 ns
131072 : 8.7 ns / 15.9 ns
262144 : 10.6 ns / 18.6 ns
524288 : 12.0 ns / 19.8 ns
1048576 : 14.1 ns / 20.5 ns
2097152 : 25.8 ns / 26.5 ns
4194304 : 80.1 ns / 158.6 ns
8388608 : 114.7 ns / 225.1 ns
16777216 : 130.4 ns / 259.3 ns
33554432 : 142.6 ns / 283.7 ns
67108864 : 148.8 ns / 295.8 ns
\##########################################################################
Executing ramlat on cpu0 (sifive,u74-mc), results in ns:
size: 1x32 2x32 1x64 2x64 1xPTR 2xPTR 4xPTR 8xPTR
4k: 2.800 2.916 2.724 2.785 2.019 2.020 2.776 5.639
8k: 2.777 2.861 2.693 2.777 2.020 2.020 2.777 5.639
16k: 2.780 2.867 2.703 2.780 2.022 2.022 2.782 5.646
32k: 2.797 2.881 2.711 2.796 2.034 2.034 2.796 5.676
64k: 13.65 24.58 13.50 24.29 13.49 24.30 48.67 97.47
128k: 13.58 24.46 13.49 24.29 13.50 24.29 48.66 98.68
256k: 13.59 24.47 13.49 24.29 13.50 24.30 48.74 97.40
512k: 13.59 24.48 13.50 24.29 13.49 24.30 51.56 97.47
1024k: 13.63 24.48 13.51 24.29 13.50 24.29 48.69 97.35
2048k: 18.78 33.58 17.85 37.19 26.43 34.24 65.48 125.3
4096k: 130.4 235.6 130.1 235.2 130.3 235.2 435.9 846.0
8192k: 156.9 272.9 156.7 273.1 156.8 272.8 511.8 983.3
16384k: 160.1 276.1 160.1 275.8 160.0 278.8 513.3 992.1
32768k: 168.4 286.1 168.3 289.1 168.3 285.5 529.4 1010
65536k: 168.5 286.0 168.5 286.4 168.5 285.7 529.7 1013
131072k: 168.4 286.3 168.4 286.3 169.2 285.5 529.7 1010
\##########################################################################
Executing benchmark twice on cluster 0 (sifive,u74-mc)
OpenSSL 3.3.2, built on 3 Sep 2024 (Library: OpenSSL 3.3.2 3 Sep 2024)
type 16 bytes 64 bytes 256 bytes 1024 bytes 8192 bytes 16384 bytes
aes-128-cbc 30073.57k 39772.48k 43416.49k 44407.47k 44788.39k 44646.40k
aes-128-cbc 30072.71k 39772.99k 43426.30k 44392.45k 44758.36k 44646.40k
aes-192-cbc 26844.44k 34256.85k 36953.26k 37726.89k 37893.46k 37814.27k
aes-192-cbc 26823.18k 34249.92k 36945.32k 37710.51k 37920.77k 37819.73k
aes-256-cbc 24205.33k 30089.09k 32152.15k 32729.43k 32877.23k 32795.31k
aes-256-cbc 24233.20k 29937.62k 32064.17k 32664.92k 32869.03k 32789.85k
\##########################################################################
Executing benchmark single-threaded on cpu0 (sifive,u74-mc)
7-Zip (a) 16.02 : Copyright (c) 1999-2016 Igor Pavlov : 2016-05-21
p7zip Version 16.02 (locale=C,Utf16=off,HugeFiles=on,64 bits,4 CPUs LE)
LE
CPU Freq: 64000000 32000000 64000000 - 128000000 256000000 512000000 - -
RAM size: 3864 MB, # CPU hardware threads: 4
RAM usage: 435 MB, # Benchmark threads: 1
Compressing | Decompressing
Dict Speed Usage R/U Rating | Speed Usage R/U Rating
KiB/s % MIPS MIPS | KiB/s % MIPS MIPS
22: 998 98 987 972 | 17146 99 1482 1464
23: 962 98 996 980 | 16819 99 1474 1456
24: 943 98 1030 1014 | 16490 99 1467 1448
25: 931 98 1081 1064 | 16246 99 1465 1446
---------------------------------- | ------------------------------
Avr: 98 1023 1007 | 99 1472 1453
Tot: 99 1248 1230
\##########################################################################
Executing benchmark 3 times multi-threaded on CPUs 0-3
7-Zip (a) 16.02 : Copyright (c) 1999-2016 Igor Pavlov : 2016-05-21
p7zip Version 16.02 (locale=C,Utf16=off,HugeFiles=on,64 bits,4 CPUs LE)
LE
CPU Freq: 64000000 64000000 - 64000000 128000000 256000000 256000000 1024000000 2048000000
RAM size: 3864 MB, # CPU hardware threads: 4
RAM usage: 882 MB, # Benchmark threads: 4
Compressing | Decompressing
Dict Speed Usage R/U Rating | Speed Usage R/U Rating
KiB/s % MIPS MIPS | KiB/s % MIPS MIPS
22: 2726 319 831 2652 | 66410 393 1441 5666
23: 2693 326 841 2744 | 65340 394 1435 5654
24: 2674 330 871 2876 | 63888 394 1425 5609
25: 2665 332 916 3044 | 62769 394 1417 5586
---------------------------------- | ------------------------------
Avr: 327 865 2829 | 394 1429 5629
Tot: 360 1147 4229
7-Zip (a) 16.02 : Copyright (c) 1999-2016 Igor Pavlov : 2016-05-21
p7zip Version 16.02 (locale=C,Utf16=off,HugeFiles=on,64 bits,4 CPUs LE)
LE
CPU Freq: 64000000 64000000 64000000 64000000 - - - - 2048000000
RAM size: 3864 MB, # CPU hardware threads: 4
RAM usage: 882 MB, # Benchmark threads: 4
Compressing | Decompressing
Dict Speed Usage R/U Rating | Speed Usage R/U Rating
KiB/s % MIPS MIPS | KiB/s % MIPS MIPS
22: 2749 321 833 2675 | 66472 394 1440 5671
23: 2675 325 839 2726 | 65120 394 1431 5635
24: 2675 330 871 2877 | 63919 394 1425 5611
25: 2660 333 912 3038 | 62701 394 1415 5580
---------------------------------- | ------------------------------
Avr: 327 864 2829 | 394 1428 5624
Tot: 361 1146 4227
7-Zip (a) 16.02 : Copyright (c) 1999-2016 Igor Pavlov : 2016-05-21
p7zip Version 16.02 (locale=C,Utf16=off,HugeFiles=on,64 bits,4 CPUs LE)
LE
CPU Freq: 64000000 - 64000000 64000000 128000000 - - - -
RAM size: 3864 MB, # CPU hardware threads: 4
RAM usage: 882 MB, # Benchmark threads: 4
Compressing | Decompressing
Dict Speed Usage R/U Rating | Speed Usage R/U Rating
KiB/s % MIPS MIPS | KiB/s % MIPS MIPS
22: 2727 319 831 2653 | 65748 390 1438 5609
23: 2668 324 839 2719 | 65169 394 1433 5639
24: 2668 328 874 2869 | 63795 393 1423 5600
25: 2650 332 913 3026 | 62780 394 1417 5587
---------------------------------- | ------------------------------
Avr: 326 864 2817 | 393 1428 5609
Tot: 359 1146 4213
Compression: 2829,2829,2817
Decompression: 5629,5624,5609
Total: 4229,4227,4213
\##########################################################################
Testing maximum cpufreq again, still under full load. System health now:
Time CPU load %cpu %sys %usr %nice %io %irq Temp
23:23:36: 1500MHz 3.58 83% 1% 80% 0% 0% 1% 43.0°C
Checking cpufreq OPP (sifive,u74-mc):
Cpufreq OPP: 1500 Measured: 1486 (1486.711/1486.598/1486.503)
\##########################################################################
Hardware sensors:
sfctemp-isa-0000
temp1: +41.9 C
\##########################################################################
Thermal source: /sys/devices/virtual/thermal/thermal_zone0/ (cpu-thermal)
System health while running tinymembench:
Time CPU load %cpu %sys %usr %nice %io %irq Temp
23:13:22: 1500MHz 0.69 41% 1% 37% 0% 1% 0% 37.5°C
23:13:32: 1500MHz 0.74 25% 0% 24% 0% 0% 0% 38.9°C
23:13:42: 1500MHz 0.78 25% 0% 24% 0% 0% 0% 39.1°C
23:13:53: 1500MHz 0.81 25% 0% 24% 0% 0% 0% 39.3°C
23:14:03: 1500MHz 0.84 25% 0% 24% 0% 0% 0% 39.4°C
23:14:13: 1500MHz 0.87 25% 0% 24% 0% 0% 0% 39.0°C
System health while running ramlat:
Time CPU load %cpu %sys %usr %nice %io %irq Temp
23:14:21: 1500MHz 0.88 40% 1% 36% 0% 1% 0% 39.3°C
23:14:24: 1500MHz 0.89 25% 0% 24% 0% 0% 0% 39.0°C
23:14:27: 1500MHz 0.90 25% 0% 24% 0% 0% 0% 39.1°C
23:14:30: 1500MHz 0.90 25% 0% 24% 0% 0% 0% 39.2°C
23:14:33: 1500MHz 0.91 25% 0% 24% 0% 0% 0% 39.3°C
23:14:36: 1500MHz 0.91 25% 0% 24% 0% 0% 0% 39.3°C
23:14:39: 1500MHz 0.91 25% 0% 24% 0% 0% 0% 39.2°C
23:14:42: 1500MHz 0.92 25% 0% 24% 0% 0% 0% 39.1°C
23:14:45: 1500MHz 0.92 25% 0% 24% 0% 0% 0% 39.0°C
23:14:48: 1500MHz 0.93 25% 0% 24% 0% 0% 0% 39.0°C
23:14:51: 1500MHz 0.93 25% 0% 24% 0% 0% 0% 39.2°C
23:14:54: 1500MHz 0.93 25% 0% 24% 0% 0% 0% 39.1°C
23:14:57: 1500MHz 0.94 25% 1% 23% 0% 0% 0% 39.2°C
System health while running OpenSSL benchmark:
Time CPU load %cpu %sys %usr %nice %io %irq Temp
23:15:01: 1500MHz 1.02 40% 1% 36% 0% 1% 0% 39.6°C
23:15:17: 1500MHz 1.02 25% 0% 24% 0% 0% 0% 39.6°C
23:15:33: 1500MHz 1.01 25% 0% 24% 0% 0% 0% 39.7°C
23:15:49: 1500MHz 1.01 25% 0% 24% 0% 0% 0% 39.8°C
23:16:05: 1500MHz 1.01 25% 0% 24% 0% 0% 0% 39.9°C
23:16:21: 1500MHz 1.00 25% 0% 24% 0% 0% 0% 39.9°C
23:16:37: 1500MHz 1.00 25% 0% 24% 0% 0% 0% 39.9°C
System health while running 7-zip single core benchmark:
Time CPU load %cpu %sys %usr %nice %io %irq Temp
23:16:49: 1500MHz 1.00 39% 1% 35% 0% 1% 0% 40.1°C
23:16:59: 1500MHz 1.00 25% 0% 24% 0% 0% 0% 39.8°C
23:17:09: 1500MHz 1.00 25% 0% 24% 0% 0% 0% 39.8°C
23:17:19: 1500MHz 1.00 25% 0% 24% 0% 0% 0% 39.7°C
23:17:29: 1500MHz 1.00 25% 0% 24% 0% 0% 0% 39.8°C
23:17:39: 1500MHz 1.07 25% 0% 24% 0% 0% 0% 39.8°C
23:17:49: 1500MHz 1.06 25% 0% 24% 0% 0% 0% 39.8°C
23:18:00: 1500MHz 1.05 25% 0% 24% 0% 0% 0% 39.9°C
23:18:10: 1500MHz 1.04 25% 0% 24% 0% 0% 0% 39.9°C
23:18:20: 1500MHz 1.04 25% 0% 24% 0% 0% 0% 39.9°C
23:18:30: 1500MHz 1.03 25% 0% 24% 0% 0% 0% 39.8°C
23:18:40: 1500MHz 1.02 25% 0% 24% 0% 0% 0% 39.9°C
System health while running 7-zip multi core benchmark:
Time CPU load %cpu %sys %usr %nice %io %irq Temp
23:18:49: 1500MHz 1.02 38% 1% 35% 0% 1% 0% 40.1°C
23:19:13: 1500MHz 1.46 84% 0% 83% 0% 0% 1% 42.2°C
23:19:34: 1500MHz 2.32 90% 0% 88% 0% 0% 1% 42.3°C
23:19:56: 1500MHz 2.73 93% 0% 91% 0% 0% 1% 42.9°C
23:20:17: 1500MHz 2.86 81% 1% 77% 0% 0% 1% 42.5°C
23:20:38: 1500MHz 3.04 87% 0% 85% 0% 0% 1% 42.5°C
23:20:59: 1500MHz 3.25 91% 0% 89% 0% 0% 1% 42.9°C
23:21:21: 1500MHz 3.37 90% 0% 88% 0% 0% 1% 42.8°C
23:21:42: 1500MHz 3.65 89% 1% 86% 0% 0% 1% 42.9°C
23:22:03: 1500MHz 3.69 87% 1% 83% 0% 0% 1% 42.9°C
23:22:27: 1500MHz 3.78 90% 0% 88% 0% 0% 1% 43.0°C
23:22:51: 1500MHz 3.71 94% 0% 92% 0% 0% 1% 43.5°C
23:23:15: 1500MHz 3.89 90% 0% 87% 0% 0% 1% 43.4°C
23:23:36: 1500MHz 3.58 83% 1% 80% 0% 0% 1% 43.0°C
\##########################################################################
Linux 6.6.20-cwt-5.12.0-3 (starfive) 09/16/24 _riscv64_ (4 CPU)
avg-cpu: %user %nice %system %iowait %steal %idle
42.54 0.02 2.15 0.97 0.00 54.33
Device tps kB_read/s kB_wrtn/s kB_dscd/s kB_read kB_wrtn kB_dscd
mmcblk1 3.13 86.24 279.95 3.70 180616 586316 7740
zram0 0.03 0.56 0.00 0.00 1180 4 0
total used free shared buff/cache available
Mem: 3.8Gi 289Mi 3.5Gi 1.8Mi 110Mi 3.5Gi
Swap: 1.9Gi 0B 1.9Gi
Filename Type Size Used Priority
/dev/zram0 partition 1978364 0 100
WARNING: ZSWAP ON TOP OF ZRAM HAS BEEN CONFIGURED ON THIS SYSTEM!
THIS WILL SEVERELY HARM PERFORMANCE IN CASE SWAPPING OCCURS!
Zswap active using zstd/zsmalloc, max pool occupation: 20%, details:
duplicate_entry:0
pool_limit_hit:0
pool_total_size:0
reject_alloc_fail:0
reject_compress_poor:0
reject_kmemcache_fail:0
reject_reclaim_fail:0
same_filled_pages:0
stored_pages:0
written_back_pages:0
CPU sysfs topology (clusters, cpufreq members, clockspeeds)
cpufreq min max
CPU cluster policy speed speed core type
0 0 0 312 1500 sifive,u74-mc
1 0 0 312 1500 sifive,u74-mc
2 0 0 312 1500 sifive,u74-mc
3 0 0 312 1500 sifive,u74-mc
Architecture: riscv64
Byte Order: Little Endian
CPU(s): 4
On-line CPU(s) list: 0-3
Vendor ID: 0x489
Model name: sifive,u74-mc
CPU family: 0x8000000000000007
Model: 0x4210427
Thread(s) per core: 1
Core(s) per socket: 4
Socket(s): 1
CPU(s) scaling MHz: 100%
CPU max MHz: 1500.0000
CPU min MHz: 312.5000
L1d cache: 128 KiB (4 instances)
L1i cache: 128 KiB (4 instances)
L2 cache: 2 MiB (1 instance)
SoC guess: StarFive JH7110
DT compat: starfive,visionfive-2-v1.3b
starfive,jh7110
Compiler: /usr/sbin/gcc (GCC) 14.2.1 20240910 / riscv64-unknown-linux-gnu
Userland: riscv64
Kernel: 6.6.20-cwt-5.12.0-3/riscv64
CONFIG_HZ=1000
CONFIG_HZ_1000=y
CONFIG_PREEMPTION=y
CONFIG_PREEMPT=y
CONFIG_PREEMPT_BUILD=y
CONFIG_PREEMPT_COUNT=y
CONFIG_PREEMPT_DYNAMIC=y
CONFIG_PREEMPT_RCU=y
\##########################################################################
cpu0/index0: 32K, level: 1, type: Instruction
cpu0/index1: 32K, level: 1, type: Data
cpu0/index2: 2048K, level: 2, type: Unified
cpu1/index0: 32K, level: 1, type: Instruction
cpu1/index1: 32K, level: 1, type: Data
cpu1/index2: 2048K, level: 2, type: Unified
cpu2/index0: 32K, level: 1, type: Instruction
cpu2/index1: 32K, level: 1, type: Data
cpu2/index2: 2048K, level: 2, type: Unified
cpu3/index0: 32K, level: 1, type: Instruction
cpu3/index1: 32K, level: 1, type: Data
cpu3/index2: 2048K, level: 2, type: Unified
\##########################################################################
cpusldo: 700 mV (0 mV max)
vdd-cpu: 1040 mV (1540 mV max)
opp-table-0:
312 MHz 800.0 mV
375 MHz 800.0 mV
417 MHz 800.0 mV
500 MHz 800.0 mV
625 MHz 800.0 mV
750 MHz 800.0 mV
1250 MHz 1000.0 mV
1500 MHz 1040.0 mV
\##########################################################################
Results validation:
* Measured clockspeed not lower than advertised max CPU clockspeed
* No swapping
* Background activity (%system) OK
* No throttling
| StarFive VisionFive 2 v1.3B | 1500 MHz | 6.6 | Arch Linux riscv64 | 4220 | 1230 | 32790 | 1060 | 780 | - |
Full Result
sbc-bench v0.9.61 StarFive VisionFive V2 (Fri, 02 Feb 2024 11:08:25 +0000)
/usr/sbin/gcc (GCC) 13.2.1 20230801
Uptime: 11:08:26 up 29 min, 1 user, load average: 0.16, 0.88, 1.33, 34.5°C, 294409116
Linux 5.15.2-cwt-5.10.3-1 (starfive) 02/02/24 _riscv64_ (4 CPU)
avg-cpu: %user %nice %system %iowait %steal %idle
22.81 0.01 2.89 6.12 0.00 68.17
Device tps kB_read/s kB_wrtn/s kB_dscd/s kB_read kB_wrtn kB_dscd
mmcblk1 4.57 97.97 415.08 101.99 173208 733876 180314
zram0 0.18 0.74 0.00 0.00 1304 4 0
total used free shared buff/cache available
Mem: 3.8Gi 234Mi 3.6Gi 4.0Mi 84Mi 3.5Gi
Swap: 1.9Gi 0B 1.9Gi
Filename Type Size Used Priority
/dev/zram0 partition 1975292 0 100
WARNING: ZSWAP ON TOP OF ZRAM HAS BEEN CONFIGURED ON THIS SYSTEM!
THIS WILL SEVERELY HARM PERFORMANCE IN CASE SWAPPING OCCURS!
Zswap active using lz4/zbud, max pool occupation: 20%, details:
duplicate_entry:0
pool_limit_hit:0
pool_total_size:0
reject_alloc_fail:0
reject_compress_poor:0
reject_kmemcache_fail:0
reject_reclaim_fail:0
same_filled_pages:0
stored_pages:0
written_back_pages:0
\##########################################################################
Checking cpufreq OPP (sifive,u74-mc):
Cpufreq OPP: 1500 Measured: 1485 (1485.977/1485.900/1485.862)
Cpufreq OPP: 750 Measured: 736 (736.089/736.080/735.939) (-1.9%)
Cpufreq OPP: 500 Measured: 485 (486.159/485.682/485.342) (-3.0%)
Cpufreq OPP: 375 Measured: 361 (361.135/361.117/360.919) (-3.7%)
\##########################################################################
Hardware sensors:
120e0000.tmon-isa-0000
temp1: +32.4 C
\##########################################################################
Executing benchmark on cpu0 (sifive,u74-mc):
tinymembench v0.4.9-nuumio (simple benchmark for memory throughput and latency)
CFLAGS:
bandwidth test min repeats (-b): 2
bandwidth test max repeats (-B): 3
bandwidth test mem realloc (-M): no (-m for realloc)
latency test repeats (-l): 3
latency test count (-c): 1000000
==========================================================================
== Memory bandwidth tests ==
== ==
== Note 1: 1MB = 1000000 bytes ==
== Note 2: Test result is the best of repeated runs. Number of repeats ==
== is shown in brackets ==
== Note 3: Results for 'copy' tests show how many bytes can be ==
== copied per second (adding together read and writen ==
== bytes would have provided twice higher numbers) ==
== Note 4: 2-pass copy means that we are using a small temporary buffer ==
== to first fetch data into it, and only then write it to the ==
== destination (source -> L1 cache, L1 cache -> destination) ==
== Note 5: If sample standard deviation exceeds 0.1%, it is shown in ==
== brackets ==
==========================================================================
C copy backwards : 943.9 MB/s (3, 3.1%)
C copy backwards (32 byte blocks) : 943.8 MB/s (3)
C copy backwards (64 byte blocks) : 943.1 MB/s (2)
C copy : 952.4 MB/s (2)
C copy prefetched (32 bytes step) : 951.8 MB/s (3, 0.9%)
C copy prefetched (64 bytes step) : 952.0 MB/s (3, 0.1%)
C 2-pass copy : 770.7 MB/s (2)
C 2-pass copy prefetched (32 bytes step) : 777.7 MB/s (3, 0.2%)
C 2-pass copy prefetched (64 bytes step) : 773.9 MB/s (3)
C scan 8 : 627.3 MB/s (2)
C scan 16 : 546.4 MB/s (2)
C scan 32 : 836.3 MB/s (3, 1.3%)
C scan 64 : 1338.6 MB/s (3, 0.4%)
C fill : 829.7 MB/s (2)
C fill (shuffle within 16 byte blocks) : 830.9 MB/s (2)
C fill (shuffle within 32 byte blocks) : 831.4 MB/s (2)
C fill (shuffle within 64 byte blocks) : 830.4 MB/s (2)
---
libc memcpy copy : 951.8 MB/s (2)
libc memchr scan : 1506.2 MB/s (2)
libc memset fill : 906.0 MB/s (3, 4.8%)
==========================================================================
== Memory latency test ==
== ==
== Average time is measured for random memory accesses in the buffers ==
== of different sizes. The larger is the buffer, the more significant ==
== are relative contributions of TLB, L1/L2 cache misses and SDRAM ==
== accesses. For extremely large buffer sizes we are expecting to see ==
== page table walk with several requests to SDRAM for almost every ==
== memory access (though 64MiB is not nearly large enough to experience ==
== this effect to its fullest). ==
== ==
== Note 1: All the numbers are representing extra time, which needs to ==
== be added to L1 cache latency. The cycle timings for L1 cache ==
== latency can be usually found in the processor documentation. ==
== Note 2: Dual random read means that we are simultaneously performing ==
== two independent memory accesses at a time. In the case if ==
== the memory subsystem can't handle multiple outstanding ==
== requests, dual random read has the same timings as two ==
== single reads performed one after another. ==
==========================================================================
block size : single random read / dual random read, [MADV_NOHUGEPAGE]
1024 : 0.0 ns / 0.0 ns
2048 : 0.0 ns / 0.0 ns
4096 : 0.0 ns / 0.0 ns
8192 : 0.0 ns / 0.0 ns
16384 : 0.1 ns / 0.0 ns
32768 : 0.2 ns / 0.1 ns
65536 : 5.8 ns / 10.6 ns
131072 : 8.8 ns / 15.9 ns
262144 : 10.6 ns / 18.5 ns
524288 : 16.3 ns / 28.5 ns
1048576 : 19.2 ns / 30.6 ns
2097152 : 36.9 ns / 58.2 ns
4194304 : 86.5 ns / 170.2 ns
8388608 : 125.6 ns / 246.9 ns
16777216 : 146.7 ns / 290.1 ns
33554432 : 160.1 ns / 318.0 ns
67108864 : 170.2 ns / 339.4 ns
block size : single random read / dual random read, [MADV_HUGEPAGE]
1024 : 0.0 ns / 0.0 ns
2048 : 0.0 ns / 0.0 ns
4096 : 0.0 ns / 0.0 ns
8192 : 0.0 ns / 0.0 ns
16384 : 0.1 ns / 0.0 ns
32768 : 0.1 ns / 0.2 ns
65536 : 5.8 ns / 10.6 ns
131072 : 8.7 ns / 15.9 ns
262144 : 10.5 ns / 18.4 ns
524288 : 11.8 ns / 19.7 ns
1048576 : 13.8 ns / 20.4 ns
2097152 : 25.8 ns / 26.1 ns
4194304 : 80.1 ns / 158.8 ns
8388608 : 114.9 ns / 225.3 ns
16777216 : 130.5 ns / 259.7 ns
33554432 : 142.7 ns / 283.8 ns
67108864 : 149.1 ns / 295.7 ns
\##########################################################################
Executing ramlat on cpu0 (sifive,u74-mc), results in ns:
size: 1x32 2x32 1x64 2x64 1xPTR 2xPTR 4xPTR 8xPTR
4k: 2.829 2.918 2.743 2.780 2.020 2.022 2.781 5.644
8k: 2.778 2.865 2.698 2.781 2.023 2.022 2.780 5.648
16k: 2.783 2.879 2.699 2.784 2.027 2.025 2.782 5.647
32k: 2.801 2.889 2.715 2.797 2.035 2.035 2.804 5.684
64k: 13.70 24.46 13.55 24.34 13.50 24.29 48.67 97.46
128k: 13.59 24.46 13.53 24.32 13.50 24.32 48.72 98.82
256k: 13.61 24.50 13.52 24.31 13.51 24.32 48.72 97.56
512k: 20.23 30.00 20.12 29.88 18.90 31.38 54.15 102.9
1024k: 20.39 30.05 20.14 29.88 18.91 29.79 54.11 102.9
2048k: 51.14 87.47 49.58 106.2 49.01 86.69 159.0 297.4
4096k: 129.2 225.5 128.4 226.1 127.6 225.2 421.8 783.1
8192k: 158.0 269.0 157.9 267.4 157.4 268.0 497.3 941.6
16384k: 171.4 285.9 171.9 286.5 171.6 285.0 514.7 974.7
32768k: 173.3 286.5 172.4 286.9 171.0 285.7 517.3 978.5
65536k: 177.1 291.5 174.8 291.7 175.7 290.7 526.9 989.1
131072k: 177.3 297.1 176.7 302.9 176.5 296.8 529.9 1005
\##########################################################################
Executing benchmark twice on cluster 0 (sifive,u74-mc)
OpenSSL 3.2.0, built on 23 Nov 2023 (Library: OpenSSL 3.2.0 23 Nov 2023)
type 16 bytes 64 bytes 256 bytes 1024 bytes 8192 bytes 16384 bytes
aes-128-cbc 31138.30k 40285.72k 43436.57k 44537.17k 44769.28k 44646.40k
aes-128-cbc 31208.69k 40338.79k 43668.74k 44591.79k 44812.97k 44706.47k
aes-192-cbc 27599.42k 34544.43k 37111.04k 37771.95k 37928.96k 37857.96k
aes-192-cbc 27676.65k 34710.85k 37102.08k 37769.22k 37931.69k 37841.58k
aes-256-cbc 24910.03k 30398.89k 32253.18k 32748.20k 32882.69k 32800.77k
aes-256-cbc 24893.64k 30377.62k 32228.44k 32776.53k 32792.49k 32822.61k
\##########################################################################
Executing benchmark single-threaded on cpu0 (sifive,u74-mc)
7-Zip (a) 17.05 : Copyright (c) 1999-2021 Igor Pavlov : 2017-08-28
p7zip Version 17.05 (locale=C,Utf16=off,HugeFiles=on,64 bits,4 CPUs LE)
LE
CPU Freq: 64000000 64000000 - 64000000 128000000 - - - -
RAM size: 3858 MB, # CPU hardware threads: 4
RAM usage: 435 MB, # Benchmark threads: 1
Compressing | Decompressing
Dict Speed Usage R/U Rating | Speed Usage R/U Rating
KiB/s % MIPS MIPS | KiB/s % MIPS MIPS
22: 888 98 877 864 | 17063 99 1476 1457
23: 856 98 886 872 | 16750 99 1469 1450
24: 828 98 906 891 | 16398 99 1458 1440
25: 798 98 926 911 | 15949 99 1439 1420
---------------------------------- | ------------------------------
Avr: 98 899 885 | 99 1460 1441
Tot: 99 1180 1163
\##########################################################################
Executing benchmark 3 times multi-threaded on CPUs 0-3
7-Zip (a) 17.05 : Copyright (c) 1999-2021 Igor Pavlov : 2017-08-28
p7zip Version 17.05 (locale=C,Utf16=off,HugeFiles=on,64 bits,4 CPUs LE)
LE
CPU Freq: - - - - 128000000 - - - -
RAM size: 3858 MB, # CPU hardware threads: 4
RAM usage: 882 MB, # Benchmark threads: 4
Compressing | Decompressing
Dict Speed Usage R/U Rating | Speed Usage R/U Rating
KiB/s % MIPS MIPS | KiB/s % MIPS MIPS
22: 2404 306 765 2339 | 66028 394 1431 5633
23: 2417 322 764 2463 | 64732 394 1422 5601
24: 2406 336 770 2588 | 63124 394 1408 5541
25: 2323 339 783 2652 | 61382 393 1389 5463
---------------------------------- | ------------------------------
Avr: 326 770 2511 | 394 1413 5560
Tot: 360 1092 4035
7-Zip (a) 17.05 : Copyright (c) 1999-2021 Igor Pavlov : 2017-08-28
p7zip Version 17.05 (locale=C,Utf16=off,HugeFiles=on,64 bits,4 CPUs LE)
LE
CPU Freq: - - - - 128000000 256000000 512000000 1024000000 2048000000
RAM size: 3858 MB, # CPU hardware threads: 4
RAM usage: 882 MB, # Benchmark threads: 4
Compressing | Decompressing
Dict Speed Usage R/U Rating | Speed Usage R/U Rating
KiB/s % MIPS MIPS | KiB/s % MIPS MIPS
22: 2106 265 773 2050 | 66140 393 1435 5643
23: 2420 323 763 2467 | 64935 394 1425 5619
24: 2424 338 772 2607 | 63245 394 1411 5552
25: 2370 345 785 2706 | 61518 393 1392 5475
---------------------------------- | ------------------------------
Avr: 318 774 2457 | 394 1416 5572
Tot: 356 1095 4015
7-Zip (a) 17.05 : Copyright (c) 1999-2021 Igor Pavlov : 2017-08-28
p7zip Version 17.05 (locale=C,Utf16=off,HugeFiles=on,64 bits,4 CPUs LE)
LE
CPU Freq: - - - 64000000 - - - 1024000000 -
RAM size: 3858 MB, # CPU hardware threads: 4
RAM usage: 882 MB, # Benchmark threads: 4
Compressing | Decompressing
Dict Speed Usage R/U Rating | Speed Usage R/U Rating
KiB/s % MIPS MIPS | KiB/s % MIPS MIPS
22: 2487 315 769 2420 | 66146 394 1433 5643
23: 2455 329 762 2502 | 64743 394 1422 5602
24: 2391 333 773 2571 | 62936 393 1406 5525
25: 2338 340 786 2670 | 61400 393 1390 5464
---------------------------------- | ------------------------------
Avr: 329 772 2541 | 394 1413 5559
Tot: 361 1092 4050
Compression: 2511,2457,2541
Decompression: 5560,5572,5559
Total: 4035,4015,4050
\##########################################################################
Testing maximum cpufreq again, still under full load. System health now:
Time CPU load %cpu %sys %usr %nice %io %irq Temp
11:19:43: 1500MHz 3.89 94% 1% 91% 0% 0% 1% 38.8°C
Checking cpufreq OPP (sifive,u74-mc):
Cpufreq OPP: 1500 Measured: 1486 (1486.035/1485.997/1485.978)
\##########################################################################
Hardware sensors:
120e0000.tmon-isa-0000
temp1: +37.1 C
\##########################################################################
Thermal source: /sys/devices/virtual/thermal/thermal_zone0/ (cpu-thermal)
System health while running tinymembench:
Time CPU load %cpu %sys %usr %nice %io %irq Temp
11:08:46: 1500MHz 0.40 31% 2% 22% 0% 6% 0% 33.9°C
11:08:56: 1500MHz 0.50 25% 0% 24% 0% 0% 0% 35.2°C
11:09:06: 1500MHz 0.57 25% 0% 24% 0% 0% 0% 35.3°C
11:09:16: 1500MHz 0.64 25% 0% 24% 0% 0% 0% 35.5°C
11:09:26: 1500MHz 0.70 25% 0% 24% 0% 0% 0% 34.9°C
System health while running ramlat:
Time CPU load %cpu %sys %usr %nice %io %irq Temp
11:09:36: 1500MHz 0.74 31% 2% 22% 0% 5% 0% 35.1°C
11:09:39: 1500MHz 0.76 25% 0% 24% 0% 0% 0% 34.9°C
11:09:42: 1500MHz 0.76 25% 0% 24% 0% 0% 0% 35.0°C
11:09:45: 1500MHz 0.78 25% 0% 24% 0% 0% 0% 35.0°C
11:09:48: 1500MHz 0.78 25% 0% 24% 0% 0% 0% 35.1°C
11:09:51: 1500MHz 0.88 25% 0% 24% 0% 0% 0% 35.0°C
11:09:54: 1500MHz 0.89 25% 0% 24% 0% 0% 0% 35.0°C
11:09:57: 1500MHz 0.89 25% 0% 24% 0% 0% 0% 34.9°C
11:10:00: 1500MHz 0.90 25% 0% 24% 0% 0% 0% 34.9°C
11:10:03: 1500MHz 0.91 25% 0% 24% 0% 0% 0% 34.9°C
11:10:07: 1500MHz 0.91 25% 0% 24% 0% 0% 0% 34.9°C
11:10:10: 1500MHz 0.91 25% 0% 24% 0% 0% 0% 34.9°C
11:10:13: 1500MHz 0.91 25% 1% 23% 0% 0% 0% 35.0°C
11:10:16: 1500MHz 0.92 25% 0% 24% 0% 0% 0% 34.9°C
System health while running OpenSSL benchmark:
Time CPU load %cpu %sys %usr %nice %io %irq Temp
11:10:17: 1500MHz 0.92 31% 2% 22% 0% 5% 0% 35.2°C
11:10:33: 1500MHz 0.94 25% 0% 24% 0% 0% 0% 35.2°C
11:10:49: 1500MHz 0.96 25% 0% 24% 0% 0% 0% 35.4°C
11:11:05: 1500MHz 0.97 25% 0% 24% 0% 0% 0% 35.4°C
11:11:21: 1500MHz 0.97 25% 0% 24% 0% 0% 0% 35.4°C
11:11:37: 1500MHz 0.98 25% 0% 24% 0% 0% 0% 35.4°C
11:11:53: 1500MHz 0.99 25% 0% 24% 0% 0% 0% 35.5°C
System health while running 7-zip single core benchmark:
Time CPU load %cpu %sys %usr %nice %io %irq Temp
11:12:05: 1500MHz 0.99 31% 2% 23% 0% 5% 0% 35.7°C
11:12:14: 1500MHz 0.99 25% 0% 24% 0% 0% 0% 35.3°C
11:12:23: 1500MHz 0.99 25% 0% 24% 0% 0% 0% 35.3°C
11:12:32: 1500MHz 0.99 25% 0% 24% 0% 0% 0% 35.3°C
11:12:41: 1500MHz 1.00 25% 0% 24% 0% 0% 0% 35.3°C
11:12:50: 1500MHz 1.00 25% 0% 24% 0% 0% 0% 35.3°C
11:12:59: 1500MHz 1.00 25% 0% 23% 0% 0% 0% 35.3°C
11:13:09: 1500MHz 1.00 25% 0% 24% 0% 0% 0% 35.3°C
11:13:18: 1500MHz 1.00 25% 0% 24% 0% 0% 0% 35.3°C
11:13:27: 1500MHz 1.00 25% 0% 24% 0% 0% 0% 35.4°C
11:13:36: 1500MHz 1.00 25% 0% 24% 0% 0% 0% 35.4°C
11:13:45: 1500MHz 1.00 25% 0% 24% 0% 0% 0% 35.3°C
11:13:54: 1500MHz 1.00 25% 0% 24% 0% 0% 0% 35.3°C
11:14:03: 1500MHz 1.00 25% 0% 24% 0% 0% 0% 35.3°C
11:14:12: 1500MHz 1.00 25% 0% 24% 0% 0% 0% 35.3°C
System health while running 7-zip multi core benchmark:
Time CPU load %cpu %sys %usr %nice %io %irq Temp
11:14:16: 1500MHz 1.00 30% 2% 23% 0% 5% 0% 36.0°C
11:14:38: 1500MHz 1.73 90% 0% 88% 0% 0% 1% 37.8°C
11:14:57: 1500MHz 2.19 92% 0% 90% 0% 0% 1% 38.2°C
11:15:22: 1500MHz 2.72 88% 1% 85% 0% 0% 1% 38.2°C
11:15:41: 1500MHz 3.24 85% 1% 81% 0% 0% 1% 38.0°C
11:16:03: 1500MHz 3.52 93% 1% 90% 0% 0% 1% 38.5°C
11:16:28: 1500MHz 3.40 72% 0% 70% 0% 0% 1% 38.2°C
11:16:49: 1500MHz 3.59 94% 0% 92% 0% 0% 1% 38.6°C
11:17:14: 1500MHz 3.64 89% 1% 86% 0% 0% 1% 38.6°C
11:17:33: 1500MHz 3.81 85% 1% 81% 0% 0% 1% 38.2°C
11:17:54: 1500MHz 3.79 96% 1% 92% 0% 0% 1% 38.7°C
11:18:17: 1500MHz 3.92 87% 0% 85% 0% 0% 1% 38.8°C
11:18:37: 1500MHz 3.95 93% 0% 91% 0% 0% 1% 38.9°C
11:19:01: 1500MHz 3.85 88% 1% 85% 0% 0% 1% 38.7°C
11:19:21: 1500MHz 3.76 85% 1% 81% 0% 0% 1% 38.3°C
11:19:43: 1500MHz 3.89 94% 1% 91% 0% 0% 1% 38.8°C
\##########################################################################
Linux 5.15.2-cwt-5.10.3-1 (starfive) 02/02/24 _riscv64_ (4 CPU)
avg-cpu: %user %nice %system %iowait %steal %idle
31.53 0.02 2.60 4.42 0.00 61.43
Device tps kB_read/s kB_wrtn/s kB_dscd/s kB_read kB_wrtn kB_dscd
mmcblk1 3.35 73.13 300.06 73.61 179152 735068 180314
zram0 0.13 0.53 0.00 0.00 1304 4 0
total used free shared buff/cache available
Mem: 3.8Gi 238Mi 3.6Gi 4.0Mi 91Mi 3.5Gi
Swap: 1.9Gi 0B 1.9Gi
Filename Type Size Used Priority
/dev/zram0 partition 1975292 0 100
WARNING: ZSWAP ON TOP OF ZRAM HAS BEEN CONFIGURED ON THIS SYSTEM!
THIS WILL SEVERELY HARM PERFORMANCE IN CASE SWAPPING OCCURS!
Zswap active using lz4/zbud, max pool occupation: 20%, details:
duplicate_entry:0
pool_limit_hit:0
pool_total_size:0
reject_alloc_fail:0
reject_compress_poor:0
reject_kmemcache_fail:0
reject_reclaim_fail:0
same_filled_pages:0
stored_pages:0
written_back_pages:0
CPU sysfs topology (clusters, cpufreq members, clockspeeds)
cpufreq min max
CPU cluster policy speed speed core type
0 0 0 375 1500 sifive,u74-mc
1 0 0 375 1500 sifive,u74-mc
2 0 0 375 1500 sifive,u74-mc
3 0 0 375 1500 sifive,u74-mc
Architecture: riscv64
Byte Order: Little Endian
CPU(s): 4
On-line CPU(s) list: 0-3
SoC guess: StarFive JH7110
DT compat: starfive,visionfive-v2
starfive,jh7110
Compiler: /usr/sbin/gcc (GCC) 13.2.1 20230801 / riscv64-unknown-linux-gnu
Userland: riscv64
Kernel: 5.15.2-cwt-5.10.3-1/riscv64
CONFIG_HZ=1000
CONFIG_HZ_1000=y
CONFIG_PREEMPTION=y
CONFIG_PREEMPT=y
CONFIG_PREEMPT_COUNT=y
CONFIG_PREEMPT_RCU=y
\##########################################################################
Kernel 5.15.2 is not latest 5.15.148 LTS that was released on 2024-01-25.
See https://endoflife.date/linux for details. It is somewhat likely that
a lot of exploitable vulnerabilities exist for this kernel as well as many
unfixed bugs.
But this version string doesn't matter since this is not an official LTS Linux
from kernel.org. This device runs a StarFive vendor/BSP kernel.
\##########################################################################
cpu0/index0: 32K, level: 1, type: Instruction
cpu0/index1: 32K, level: 1, type: Data
cpu0/index2: 2048K, level: 2, type: Unified
cpu1/index0: 32K, level: 1, type: Instruction
cpu1/index1: 32K, level: 1, type: Data
cpu1/index2: 2048K, level: 2, type: Unified
cpu2/index0: 32K, level: 1, type: Instruction
cpu2/index1: 32K, level: 1, type: Data
cpu2/index2: 2048K, level: 2, type: Unified
cpu3/index0: 32K, level: 1, type: Instruction
cpu3/index1: 32K, level: 1, type: Data
cpu3/index2: 2048K, level: 2, type: Unified
\##########################################################################
cpu_vdd: 1040 mV (1540 mV max)
opp-table-0:
375 MHz 800.0 mV
500 MHz 800.0 mV
750 MHz 800.0 mV
1500 MHz 1040.0 mV
\##########################################################################
Results validation:
* Measured clockspeed not lower than advertised max CPU clockspeed
* No swapping
* Background activity (%system) OK
* No throttling
| StarFive VisionFive V2 | 1500 MHz | 5.15 | Arch Linux riscv64 | 4030 | 1163 | 32810 | 950 | 910 | - |
Full Result
```
sbc-bench v0.9.42 StarFive VisionFive V2 (Sun, 09 Jul 2023 10:17:55 +0000)
/usr/sbin/gcc (GCC) 13.1.1 20230429
Uptime: 10:17:55 up 9 min, 1 user, load average: 2.44, 1.13, 0.47, 51.3°C, 281418066
Linux 5.15.2-cwt-3.1.5-1 (ArchVF2) 07/09/23 _riscv64_ (4 CPU)
avg-cpu: %user %nice %system %iowait %steal %idle
4.24 0.01 3.46 2.63 0.00 89.66
Device tps kB_read/s kB_wrtn/s kB_dscd/s kB_read kB_wrtn kB_dscd
mmcblk1 9.27 316.89 892.13 63.62 188624 531029 37868
zram0 0.55 2.19 0.01 0.00 1304 4 0
total used free shared buff/cache available
Mem: 3.8Gi 247Mi 3.6Gi 4.7Mi 76Mi 3.5Gi
Swap: 1.9Gi 0B 1.9Gi
Filename Type Size Used Priority
/dev/zram0 partition 1985532 0 100
WARNING: ZSWAP ON TOP OF ZRAM HAS BEEN CONFIGURED ON THIS SYSTEM!
THIS WILL SEVERELY HARM PERFORMANCE IN CASE SWAPPING OCCURS!
Zswap active using lz4/zbud, max pool occupation: 20%, details:
duplicate_entry:0
pool_limit_hit:0
pool_total_size:0
reject_alloc_fail:0
reject_compress_poor:0
reject_kmemcache_fail:0
reject_reclaim_fail:0
same_filled_pages:0
stored_pages:0
written_back_pages:0
##########################################################################
Checking cpufreq OPP (sifive,u74-mc):
Cpufreq OPP: 1500 Measured: 1486 (1487.365/1485.885/1485.866)
Cpufreq OPP: 750 Measured: 735 (736.147/735.969/735.772) (-2.0%)
Cpufreq OPP: 500 Measured: 485 (486.119/485.896/485.772) (-3.0%)
Cpufreq OPP: 375 Measured: 361 (361.147/361.106/361.032) (-3.7%)
##########################################################################
Hardware sensors:
120e0000.tmon-isa-0000
temp1: +52.0 C
##########################################################################
Executing benchmark on cpu0 (sifive,u74-mc):
tinymembench v0.4.9-nuumio (simple benchmark for memory throughput and latency)
CFLAGS:
bandwidth test min repeats (-b): 2
bandwidth test max repeats (-B): 3
bandwidth test mem realloc (-M): no (-m for realloc)
latency test repeats (-l): 3
latency test count (-c): 1000000
==========================================================================
== Memory bandwidth tests ==
== ==
== Note 1: 1MB = 1000000 bytes ==
== Note 2: Test result is the best of repeated runs. Number of repeats ==
== is shown in brackets ==
== Note 3: Results for 'copy' tests show how many bytes can be ==
== copied per second (adding together read and writen ==
== bytes would have provided twice higher numbers) ==
== Note 4: 2-pass copy means that we are using a small temporary buffer ==
== to first fetch data into it, and only then write it to the ==
== destination (source -> L1 cache, L1 cache -> destination) ==
== Note 5: If sample standard deviation exceeds 0.1%, it is shown in ==
== brackets ==
==========================================================================
C copy backwards : 918.8 MB/s (3, 3.1%)
C copy backwards (32 byte blocks) : 919.1 MB/s (2)
C copy backwards (64 byte blocks) : 919.2 MB/s (2)
C copy : 927.0 MB/s (2)
C copy prefetched (32 bytes step) : 927.2 MB/s (3, 0.3%)
C copy prefetched (64 bytes step) : 927.0 MB/s (2)
C 2-pass copy : 761.2 MB/s (2)
C 2-pass copy prefetched (32 bytes step) : 767.6 MB/s (3, 0.2%)
C 2-pass copy prefetched (64 bytes step) : 763.6 MB/s (2)
C scan 8 : 627.4 MB/s (2)
C scan 16 : 546.4 MB/s (2)
C scan 32 : 860.6 MB/s (3, 1.8%)
C scan 64 : 1630.5 MB/s (3, 13.3%)
C fill : 831.9 MB/s (2)
C fill (shuffle within 16 byte blocks) : 833.3 MB/s (2)
C fill (shuffle within 32 byte blocks) : 831.1 MB/s (2)
C fill (shuffle within 64 byte blocks) : 832.1 MB/s (3)
---
libc memcpy copy : 927.0 MB/s (3)
libc memchr scan : 1195.6 MB/s (3, 0.2%)
libc memset fill : 831.7 MB/s (2)
==========================================================================
== Memory latency test ==
== ==
== Average time is measured for random memory accesses in the buffers ==
== of different sizes. The larger is the buffer, the more significant ==
== are relative contributions of TLB, L1/L2 cache misses and SDRAM ==
== accesses. For extremely large buffer sizes we are expecting to see ==
== page table walk with several requests to SDRAM for almost every ==
== memory access (though 64MiB is not nearly large enough to experience ==
== this effect to its fullest). ==
== ==
== Note 1: All the numbers are representing extra time, which needs to ==
== be added to L1 cache latency. The cycle timings for L1 cache ==
== latency can be usually found in the processor documentation. ==
== Note 2: Dual random read means that we are simultaneously performing ==
== two independent memory accesses at a time. In the case if ==
== the memory subsystem can't handle multiple outstanding ==
== requests, dual random read has the same timings as two ==
== single reads performed one after another. ==
==========================================================================
block size : single random read / dual random read, [MADV_NOHUGEPAGE]
1024 : 0.0 ns / 0.0 ns
2048 : 0.0 ns / 0.0 ns
4096 : 0.0 ns / 0.0 ns
8192 : 0.0 ns / 0.0 ns
16384 : 0.1 ns / 0.0 ns
32768 : 0.2 ns / 0.1 ns
65536 : 5.8 ns / 10.6 ns
131072 : 8.8 ns / 15.9 ns
262144 : 10.6 ns / 18.4 ns
524288 : 16.5 ns / 29.3 ns
1048576 : 19.2 ns / 30.7 ns
2097152 : 39.6 ns / 64.2 ns
4194304 : 86.5 ns / 170.6 ns
8388608 : 125.4 ns / 247.0 ns
16777216 : 146.3 ns / 290.3 ns
33554432 : 159.7 ns / 317.6 ns
67108864 : 169.8 ns / 338.6 ns
block size : single random read / dual random read, [MADV_HUGEPAGE]
1024 : 0.0 ns / 0.0 ns
2048 : 0.0 ns / 0.0 ns
4096 : 0.0 ns / 0.0 ns
8192 : 0.0 ns / 0.0 ns
16384 : 0.1 ns / 0.0 ns
32768 : 0.1 ns / 0.1 ns
65536 : 5.8 ns / 10.6 ns
131072 : 8.7 ns / 15.9 ns
262144 : 10.6 ns / 18.4 ns
524288 : 11.8 ns / 19.7 ns
1048576 : 13.8 ns / 20.4 ns
2097152 : 26.0 ns / 26.9 ns
4194304 : 80.0 ns / 158.5 ns
8388608 : 114.7 ns / 225.5 ns
16777216 : 130.6 ns / 259.5 ns
33554432 : 142.8 ns / 283.4 ns
67108864 : 148.9 ns / 296.0 ns
##########################################################################
Executing ramlat on cpu0 (sifive,u74-mc), results in ns:
size: 1x32 2x32 1x64 2x64 1xPTR 2xPTR 4xPTR 8xPTR
4k: 2.828 2.909 2.722 2.782 2.021 2.020 2.778 5.642
8k: 2.780 2.864 2.694 2.779 2.021 2.025 2.780 5.648
16k: 2.783 2.883 2.699 2.782 2.025 2.025 2.784 5.647
32k: 2.798 2.882 2.716 2.801 2.035 2.035 2.799 5.686
64k: 13.74 24.48 13.54 24.32 13.51 24.30 48.73 97.45
128k: 13.60 24.50 13.55 24.30 13.51 24.29 49.55 97.48
256k: 13.59 24.48 13.51 24.33 13.50 24.31 48.71 97.48
512k: 19.54 30.00 20.14 29.86 18.90 32.54 54.12 102.9
1024k: 20.05 30.44 20.35 30.25 19.12 30.06 54.92 104.1
2048k: 51.90 86.55 60.80 87.50 50.10 85.98 157.8 297.2
4096k: 126.5 221.6 126.3 221.4 125.5 221.4 418.4 770.4
8192k: 158.8 272.7 158.5 270.8 157.9 273.7 495.8 945.2
16384k: 164.5 279.3 164.6 277.3 164.4 276.6 507.9 971.8
32768k: 174.8 289.6 176.5 290.7 174.3 288.9 518.1 983.3
65536k: 174.9 291.3 174.8 291.7 174.6 290.3 527.7 985.2
131072k: 177.7 296.7 179.8 296.2 176.6 295.9 529.4 1005
##########################################################################
Executing benchmark twice on cluster 0 (sifive,u74-mc)
OpenSSL 3.1.1, built on 30 May 2023 (Library: OpenSSL 3.1.1 30 May 2023)
type 16 bytes 64 bytes 256 bytes 1024 bytes 8192 bytes 16384 bytes
aes-128-cbc 26713.37k 33158.38k 35514.54k 36161.88k 36345.17k 36252.33k
aes-128-cbc 26643.53k 33099.82k 35499.78k 36162.90k 36323.33k 36241.41k
aes-192-cbc 23883.17k 28842.69k 30630.14k 31116.63k 31222.44k 31162.37k
aes-192-cbc 23538.88k 28718.44k 30570.15k 31062.70k 31216.98k 31151.45k
aes-256-cbc 21542.26k 25437.31k 26880.26k 27282.43k 27372.20k 27306.67k
aes-256-cbc 21558.49k 25505.83k 26906.28k 27281.75k 27374.93k 27317.59k
##########################################################################
Executing benchmark single-threaded on cpu0 (sifive,u74-mc)
7-Zip (a) 17.04 : Copyright (c) 1999-2021 Igor Pavlov : 2017-08-28
p7zip Version 17.04 (locale=C,Utf16=off,HugeFiles=on,64 bits,4 CPUs LE)
LE
CPU Freq: 64000000 - 64000000 - - - - - 2048000000
RAM size: 3878 MB, # CPU hardware threads: 4
RAM usage: 435 MB, # Benchmark threads: 1
Compressing | Decompressing
Dict Speed Usage R/U Rating | Speed Usage R/U Rating
KiB/s % MIPS MIPS | KiB/s % MIPS MIPS
22: 901 98 891 877 | 17294 99 1496 1477
23: 863 98 894 880 | 16980 99 1489 1470
24: 834 98 912 898 | 16634 99 1479 1460
25: 804 98 934 919 | 16199 99 1461 1442
---------------------------------- | ------------------------------
Avr: 98 908 893 | 99 1481 1462
Tot: 99 1194 1178
##########################################################################
Executing benchmark 3 times multi-threaded on CPUs 0-3
7-Zip (a) 17.04 : Copyright (c) 1999-2021 Igor Pavlov : 2017-08-28
p7zip Version 17.04 (locale=C,Utf16=off,HugeFiles=on,64 bits,4 CPUs LE)
LE
CPU Freq: - - - - - - 512000000 - 2048000000
RAM size: 3878 MB, # CPU hardware threads: 4
RAM usage: 882 MB, # Benchmark threads: 4
Compressing | Decompressing
Dict Speed Usage R/U Rating | Speed Usage R/U Rating
KiB/s % MIPS MIPS | KiB/s % MIPS MIPS
22: 2574 318 789 2505 | 66761 393 1450 5696
23: 2528 330 781 2576 | 65581 394 1440 5674
24: 2507 342 789 2696 | 63868 393 1426 5607
25: 2390 340 802 2730 | 62202 393 1407 5536
---------------------------------- | ------------------------------
Avr: 332 790 2627 | 393 1431 5628
Tot: 363 1111 4128
7-Zip (a) 17.04 : Copyright (c) 1999-2021 Igor Pavlov : 2017-08-28
p7zip Version 17.04 (locale=C,Utf16=off,HugeFiles=on,64 bits,4 CPUs LE)
LE
CPU Freq: 64000000 - - 64000000 128000000 256000000 - - -
RAM size: 3878 MB, # CPU hardware threads: 4
RAM usage: 882 MB, # Benchmark threads: 4
Compressing | Decompressing
Dict Speed Usage R/U Rating | Speed Usage R/U Rating
KiB/s % MIPS MIPS | KiB/s % MIPS MIPS
22: 2571 317 788 2502 | 66990 394 1451 5715
23: 2550 333 780 2599 | 65557 394 1440 5672
24: 2489 339 790 2677 | 63838 393 1426 5604
25: 2378 338 803 2716 | 62294 393 1410 5544
---------------------------------- | ------------------------------
Avr: 332 790 2623 | 393 1432 5634
Tot: 363 1111 4129
7-Zip (a) 17.04 : Copyright (c) 1999-2021 Igor Pavlov : 2017-08-28
p7zip Version 17.04 (locale=C,Utf16=off,HugeFiles=on,64 bits,4 CPUs LE)
LE
CPU Freq: 64000000 64000000 - - - - - - 2048000000
RAM size: 3878 MB, # CPU hardware threads: 4
RAM usage: 882 MB, # Benchmark threads: 4
Compressing | Decompressing
Dict Speed Usage R/U Rating | Speed Usage R/U Rating
KiB/s % MIPS MIPS | KiB/s % MIPS MIPS
22: 2630 325 786 2558 | 67013 394 1452 5717
23: 2495 326 780 2543 | 65578 394 1440 5674
24: 2483 338 789 2670 | 63821 393 1426 5603
25: 2452 350 801 2800 | 62279 394 1408 5543
---------------------------------- | ------------------------------
Avr: 335 789 2643 | 394 1432 5634
Tot: 364 1110 4138
Compression: 2627,2623,2643
Decompression: 5628,5634,5634
Total: 4128,4129,4138
##########################################################################
Testing maximum cpufreq again, still under full load. System health now:
Time CPU load %cpu %sys %usr %nice %io %irq Temp
10:29:03: 1500MHz 4.05 96% 1% 92% 0% 0% 1% 68.5°C
Checking cpufreq OPP (sifive,u74-mc):
Cpufreq OPP: 1500 Measured: 1485 (1486.056/1485.905/1485.848)
##########################################################################
Hardware sensors:
120e0000.tmon-isa-0000
temp1: +66.5 C
##########################################################################
Thermal source: /sys/devices/virtual/thermal/thermal_zone0/ (cpu-thermal)
System health while running tinymembench:
Time CPU load %cpu %sys %usr %nice %io %irq Temp
10:18:15: 1500MHz 2.12 10% 3% 4% 0% 2% 0% 53.5°C
10:18:25: 1500MHz 2.02 25% 0% 24% 0% 0% 0% 55.7°C
10:18:35: 1500MHz 1.87 25% 0% 24% 0% 0% 0% 56.2°C
10:18:45: 1500MHz 1.73 27% 0% 24% 0% 1% 0% 56.7°C
10:18:55: 1500MHz 1.64 25% 0% 24% 0% 0% 0% 56.2°C
System health while running ramlat:
Time CPU load %cpu %sys %usr %nice %io %irq Temp
10:19:05: 1500MHz 1.62 12% 2% 6% 0% 2% 0% 56.5°C
10:19:08: 1500MHz 1.62 25% 0% 24% 0% 0% 0% 56.4°C
10:19:12: 1500MHz 1.57 25% 0% 24% 0% 0% 0% 56.4°C
10:19:15: 1500MHz 1.57 25% 0% 24% 0% 0% 0% 56.6°C
10:19:18: 1500MHz 1.52 25% 0% 24% 0% 0% 0% 56.7°C
10:19:21: 1500MHz 1.48 25% 0% 24% 0% 0% 0% 56.8°C
10:19:24: 1500MHz 1.48 25% 0% 24% 0% 0% 0% 56.7°C
10:19:27: 1500MHz 1.44 25% 0% 24% 0% 0% 0% 56.6°C
10:19:30: 1500MHz 1.44 25% 0% 24% 0% 0% 0% 56.7°C
10:19:33: 1500MHz 1.41 25% 0% 24% 0% 0% 0% 56.7°C
10:19:36: 1500MHz 1.37 26% 0% 24% 0% 0% 0% 56.7°C
10:19:39: 1500MHz 1.37 26% 0% 24% 0% 1% 0% 56.8°C
10:19:42: 1500MHz 1.34 25% 1% 23% 0% 0% 0% 56.9°C
10:19:45: 1500MHz 1.34 25% 0% 24% 0% 0% 0% 56.9°C
System health while running OpenSSL benchmark:
Time CPU load %cpu %sys %usr %nice %io %irq Temp
10:19:46: 1500MHz 1.32 12% 2% 7% 0% 2% 0% 57.3°C
10:20:02: 1500MHz 1.25 25% 0% 24% 0% 0% 0% 57.5°C
10:20:18: 1500MHz 1.35 25% 0% 24% 0% 0% 0% 57.8°C
10:20:34: 1500MHz 1.27 25% 0% 24% 0% 0% 0% 58.1°C
10:20:50: 1500MHz 1.19 25% 0% 24% 0% 0% 0% 58.2°C
10:21:07: 1500MHz 1.15 25% 0% 24% 0% 0% 0% 58.5°C
10:21:23: 1500MHz 1.12 25% 0% 24% 0% 0% 0% 58.6°C
System health while running 7-zip single core benchmark:
Time CPU load %cpu %sys %usr %nice %io %irq Temp
10:21:34: 1500MHz 1.10 14% 2% 9% 0% 2% 0% 58.9°C
10:21:44: 1500MHz 1.08 25% 0% 24% 0% 0% 0% 58.7°C
10:21:53: 1500MHz 1.07 25% 0% 24% 0% 0% 0% 58.8°C
10:22:02: 1500MHz 1.06 25% 0% 24% 0% 0% 0% 58.9°C
10:22:11: 1500MHz 1.05 25% 0% 24% 0% 0% 0% 58.9°C
10:22:20: 1500MHz 1.05 25% 0% 24% 0% 0% 0% 59.1°C
10:22:29: 1500MHz 1.04 25% 0% 24% 0% 0% 0% 59.1°C
10:22:38: 1500MHz 1.03 25% 0% 24% 0% 0% 0% 59.2°C
10:22:47: 1500MHz 1.03 25% 0% 24% 0% 0% 0% 59.2°C
10:22:56: 1500MHz 1.02 25% 0% 24% 0% 0% 0% 59.3°C
10:23:05: 1500MHz 1.02 26% 0% 24% 0% 0% 0% 59.5°C
10:23:14: 1500MHz 1.02 25% 0% 24% 0% 0% 0% 59.5°C
10:23:23: 1500MHz 1.01 25% 0% 24% 0% 0% 0% 59.6°C
10:23:32: 1500MHz 1.01 25% 0% 24% 0% 0% 0% 59.6°C
10:23:41: 1500MHz 1.01 27% 0% 24% 0% 1% 0% 59.7°C
System health while running 7-zip multi core benchmark:
Time CPU load %cpu %sys %usr %nice %io %irq Temp
10:23:45: 1500MHz 1.01 16% 2% 11% 0% 1% 0% 59.9°C
10:24:08: 1500MHz 1.73 86% 0% 84% 0% 0% 1% 62.9°C
10:24:27: 1500MHz 2.57 93% 0% 91% 0% 0% 1% 63.9°C
10:24:52: 1500MHz 2.91 90% 1% 87% 0% 0% 1% 64.6°C
10:25:12: 1500MHz 3.50 86% 2% 82% 0% 0% 1% 64.7°C
10:25:31: 1500MHz 3.57 93% 1% 90% 0% 0% 1% 65.7°C
10:25:54: 1500MHz 3.76 89% 0% 87% 0% 0% 1% 66.0°C
10:26:13: 1500MHz 3.63 93% 0% 90% 0% 0% 1% 66.1°C
10:26:37: 1500MHz 3.73 90% 1% 87% 0% 0% 1% 66.7°C
10:26:57: 1500MHz 3.81 85% 2% 82% 0% 0% 1% 66.5°C
10:27:17: 1500MHz 3.87 93% 1% 90% 0% 0% 1% 67.3°C
10:27:40: 1500MHz 3.71 86% 0% 84% 0% 0% 1% 67.6°C
10:27:59: 1500MHz 3.66 93% 0% 91% 0% 0% 1% 67.9°C
10:28:24: 1500MHz 3.82 89% 1% 86% 0% 0% 1% 68.0°C
10:28:44: 1500MHz 3.89 87% 2% 83% 0% 0% 1% 67.9°C
10:29:03: 1500MHz 4.05 96% 1% 92% 0% 0% 1% 68.5°C
##########################################################################
Linux 5.15.2-cwt-3.1.5-1 (ArchVF2) 07/09/23 _riscv64_ (4 CPU)
avg-cpu: %user %nice %system %iowait %steal %idle
30.72 0.02 2.63 1.33 0.00 65.30
Device tps kB_read/s kB_wrtn/s kB_dscd/s kB_read kB_wrtn kB_dscd
mmcblk1 4.59 153.83 426.97 29.93 194992 541205 37944
zram0 0.26 1.03 0.00 0.00 1304 4 0
total used free shared buff/cache available
Mem: 3.8Gi 239Mi 3.6Gi 4.7Mi 89Mi 3.6Gi
Swap: 1.9Gi 0B 1.9Gi
Filename Type Size Used Priority
/dev/zram0 partition 1985532 0 100
WARNING: ZSWAP ON TOP OF ZRAM HAS BEEN CONFIGURED ON THIS SYSTEM!
THIS WILL SEVERELY HARM PERFORMANCE IN CASE SWAPPING OCCURS!
Zswap active using lz4/zbud, max pool occupation: 20%, details:
duplicate_entry:0
pool_limit_hit:0
pool_total_size:0
reject_alloc_fail:0
reject_compress_poor:0
reject_kmemcache_fail:0
reject_reclaim_fail:0
same_filled_pages:0
stored_pages:0
written_back_pages:0
CPU sysfs topology (clusters, cpufreq members, clockspeeds)
cpufreq min max
CPU cluster policy speed speed core type
0 0 0 375 1500 sifive,u74-mc
1 0 0 375 1500 sifive,u74-mc
2 0 0 375 1500 sifive,u74-mc
3 0 0 375 1500 sifive,u74-mc
Architecture: riscv64
Byte Order: Little Endian
CPU(s): 4
On-line CPU(s) list: 0-3
SoC guess: StarFive JH7110
DT compat: starfive,visionfive-v2
starfive,jh7110
Compiler: /usr/sbin/gcc (GCC) 13.1.1 20230429 / riscv64-unknown-linux-gnu
Userland: riscv64
Kernel: 5.15.2-cwt-3.1.5-1/riscv64
CONFIG_HZ=1000
CONFIG_HZ_1000=y
CONFIG_PREEMPTION=y
CONFIG_PREEMPT=y
CONFIG_PREEMPT_COUNT=y
CONFIG_PREEMPT_RCU=y
##########################################################################
Kernel 5.15.2 is not latest 5.15.120 LTS that was released on 2023-07-05.
See https://endoflife.date/linux for details. It is somewhat likely that
a lot of exploitable vulnerabilities exist for this kernel as well as many
unfixed bugs.
But this version string doesn't matter since this is not an official LTS Linux
from kernel.org. This device runs a StarFive vendor/BSP kernel.
##########################################################################
cpu0/index0: 32K, level: 1, type: Instruction
cpu0/index1: 32K, level: 1, type: Data
cpu0/index2: 2048K, level: 2, type: Unified
cpu1/index0: 32K, level: 1, type: Instruction
cpu1/index1: 32K, level: 1, type: Data
cpu1/index2: 2048K, level: 2, type: Unified
cpu2/index0: 32K, level: 1, type: Instruction
cpu2/index1: 32K, level: 1, type: Data
cpu2/index2: 2048K, level: 2, type: Unified
cpu3/index0: 32K, level: 1, type: Instruction
cpu3/index1: 32K, level: 1, type: Data
cpu3/index2: 2048K, level: 2, type: Unified
##########################################################################
cpu_vdd: 1040 mV (1540 mV max)
opp-table-0:
375 MHz 800.0 mV
500 MHz 800.0 mV
750 MHz 800.0 mV
1500 MHz 1040.0 mV
##########################################################################
Results validation:
* Measured clockspeed not lower than advertised max CPU clockspeed
* No swapping
* Background activity (%system) OK
* Zswap combined with ZRAM. Swapping performance severely harmed
* No throttling
| StarFive VisionFive V2 | 1500 MHz | 5.15 | Arch Linux riscv64 | 4130 | 1178 | 27310 | 930 | 830 | - |
```
Full results
```
sbc-bench v0.9.42 StarFive VisionFive V2 (Sat, 08 Jul 2023 13:26:34 +0000)
Distributor ID: Debian
Description: Debian GNU/Linux trixie/sid
Codename: trixie
/usr/bin/gcc (Debian 12.3.0-4) 12.3.0
Uptime: 13:26:35 up 4 min, 2 users, load average: 0.17, 0.36, 0.18, 51.0°C, 348672736
Linux 5.15.0-starfive (starfive) 07/08/23 _riscv64_ (4 CPU)
avg-cpu: %user %nice %system %iowait %steal %idle
3.47 0.00 2.83 3.16 0.00 90.53
Device tps kB_read/s kB_wrtn/s kB_dscd/s kB_read kB_wrtn kB_dscd
mmcblk1 35.67 1319.56 107.46 0.00 338349 27553 0
total used free shared buff/cache available
Mem: 3.8Gi 127Mi 3.7Gi 3.0Mi 64Mi 3.7Gi
Swap: 0B 0B 0B
##########################################################################
Checking cpufreq OPP (sifive,u74-mc):
Cpufreq OPP: 1500 Measured: 1498 (1498.934/1498.915/1498.877)
Cpufreq OPP: 750 Measured: 748 (748.969/748.825/748.806)
Cpufreq OPP: 500 Measured: 498 (498.938/498.786/498.722)
Cpufreq OPP: 375 Measured: 373 (373.815/373.777/373.529)
##########################################################################
Hardware sensors:
120e0000.tmon-isa-0000
temp1: +50.8 C
##########################################################################
Executing benchmark on cpu0 (sifive,u74-mc):
tinymembench v0.4.9-nuumio (simple benchmark for memory throughput and latency)
CFLAGS:
bandwidth test min repeats (-b): 2
bandwidth test max repeats (-B): 3
bandwidth test mem realloc (-M): no (-m for realloc)
latency test repeats (-l): 3
latency test count (-c): 1000000
==========================================================================
== Memory bandwidth tests ==
== ==
== Note 1: 1MB = 1000000 bytes ==
== Note 2: Test result is the best of repeated runs. Number of repeats ==
== is shown in brackets ==
== Note 3: Results for 'copy' tests show how many bytes can be ==
== copied per second (adding together read and writen ==
== bytes would have provided twice higher numbers) ==
== Note 4: 2-pass copy means that we are using a small temporary buffer ==
== to first fetch data into it, and only then write it to the ==
== destination (source -> L1 cache, L1 cache -> destination) ==
== Note 5: If sample standard deviation exceeds 0.1%, it is shown in ==
== brackets ==
==========================================================================
C copy backwards : 946.2 MB/s (3, 3.6%)
C copy backwards (32 byte blocks) : 946.2 MB/s (2)
C copy backwards (64 byte blocks) : 945.7 MB/s (2)
C copy : 954.5 MB/s (2)
C copy prefetched (32 bytes step) : 953.4 MB/s (3, 0.6%)
C copy prefetched (64 bytes step) : 954.0 MB/s (2)
C 2-pass copy : 758.4 MB/s (2)
C 2-pass copy prefetched (32 bytes step) : 764.6 MB/s (3, 0.2%)
C 2-pass copy prefetched (64 bytes step) : 761.9 MB/s (2)
C scan 8 : 586.2 MB/s (3, 0.6%)
C scan 16 : 555.1 MB/s (2)
C scan 32 : 1029.0 MB/s (2)
C scan 64 : 1276.8 MB/s (2)
C fill : 837.3 MB/s (2)
C fill (shuffle within 16 byte blocks) : 837.2 MB/s (2)
C fill (shuffle within 32 byte blocks) : 837.3 MB/s (2)
C fill (shuffle within 64 byte blocks) : 837.7 MB/s (2)
---
libc memcpy copy : 951.9 MB/s (2)
libc memchr scan : 1219.1 MB/s (2)
libc memset fill : 897.0 MB/s (3, 3.8%)
==========================================================================
== Memory latency test ==
== ==
== Average time is measured for random memory accesses in the buffers ==
== of different sizes. The larger is the buffer, the more significant ==
== are relative contributions of TLB, L1/L2 cache misses and SDRAM ==
== accesses. For extremely large buffer sizes we are expecting to see ==
== page table walk with several requests to SDRAM for almost every ==
== memory access (though 64MiB is not nearly large enough to experience ==
== this effect to its fullest). ==
== ==
== Note 1: All the numbers are representing extra time, which needs to ==
== be added to L1 cache latency. The cycle timings for L1 cache ==
== latency can be usually found in the processor documentation. ==
== Note 2: Dual random read means that we are simultaneously performing ==
== two independent memory accesses at a time. In the case if ==
== the memory subsystem can't handle multiple outstanding ==
== requests, dual random read has the same timings as two ==
== single reads performed one after another. ==
==========================================================================
block size : single random read / dual random read
1024 : 0.0 ns / 0.0 ns
2048 : 0.0 ns / 0.0 ns
4096 : 0.0 ns / 0.0 ns
8192 : 0.0 ns / 0.0 ns
16384 : 0.0 ns / 0.0 ns
32768 : 0.1 ns / 0.0 ns
65536 : 5.5 ns / 10.5 ns
131072 : 8.3 ns / 15.8 ns
262144 : 10.0 ns / 18.6 ns
524288 : 16.0 ns / 28.6 ns
1048576 : 19.5 ns / 30.6 ns
2097152 : 35.7 ns / 53.6 ns
4194304 : 84.8 ns / 165.1 ns
8388608 : 123.1 ns / 241.7 ns
16777216 : 144.1 ns / 285.3 ns
33554432 : 157.3 ns / 312.6 ns
67108864 : 167.6 ns / 334.5 ns
##########################################################################
Executing ramlat on cpu0 (sifive,u74-mc), results in ns:
size: 1x32 2x32 1x64 2x64 1xPTR 2xPTR 4xPTR 8xPTR
4k: 2.778 2.847 2.674 2.756 2.003 2.002 2.753 5.588
8k: 2.753 2.837 2.669 2.753 2.002 2.002 2.753 5.588
16k: 2.757 2.837 2.670 2.754 2.002 2.003 2.753 5.593
32k: 2.762 2.838 2.671 2.754 2.003 2.004 2.762 5.593
64k: 13.48 24.12 13.35 24.10 13.35 24.03 48.15 96.37
128k: 13.47 24.11 13.35 24.11 13.45 24.03 48.14 96.50
256k: 13.44 24.14 13.35 24.11 13.35 24.03 48.15 96.60
512k: 20.12 30.90 20.04 29.58 18.69 29.37 53.48 101.9
1024k: 20.17 29.65 19.99 29.59 18.72 29.39 53.54 112.8
2048k: 53.46 90.24 52.58 89.95 50.72 90.25 166.9 312.1
4096k: 126.6 220.9 127.0 230.7 125.5 221.2 404.0 768.0
8192k: 156.3 266.5 156.6 270.4 156.1 265.3 486.6 930.2
16384k: 167.6 278.6 167.4 278.3 166.7 276.9 503.8 956.0
32768k: 172.4 286.2 171.3 284.7 171.4 283.4 511.0 968.1
65536k: 171.1 285.1 171.1 286.5 171.0 287.4 512.0 968.1
131072k: 173.6 293.0 172.7 288.4 172.7 287.5 517.9 981.4
##########################################################################
Executing benchmark twice on cluster 0 (sifive,u74-mc)
OpenSSL 3.0.9, built on 30 May 2023 (Library: OpenSSL 3.0.9 30 May 2023)
type 16 bytes 64 bytes 256 bytes 1024 bytes 8192 bytes 16384 bytes
aes-128-cbc 24254.94k 29816.04k 31697.75k 32206.51k 32347.48k 32314.71k
aes-128-cbc 22069.55k 29024.41k 31473.58k 32077.14k 32306.52k 32314.71k
aes-192-cbc 21428.23k 26155.80k 27729.24k 28092.42k 28254.21k 28246.02k
aes-192-cbc 21349.81k 26126.76k 27704.75k 28090.03k 28256.94k 28240.55k
aes-256-cbc 20020.66k 23400.26k 24707.93k 24986.97k 25100.29k 25094.83k
aes-256-cbc 19955.96k 23521.81k 24706.39k 25014.61k 25100.29k 24995.13k
##########################################################################
Executing benchmark single-threaded on cpu0 (sifive,u74-mc)
7-Zip (a) 16.02 : Copyright (c) 1999-2016 Igor Pavlov : 2016-05-21
p7zip Version 16.02 (locale=C,Utf16=off,HugeFiles=on,64 bits,4 CPUs LE)
LE
CPU Freq: 32000000 64000000 - - - - 512000000 1024000000 -
RAM size: 3891 MB, # CPU hardware threads: 4
RAM usage: 435 MB, # Benchmark threads: 1
Compressing | Decompressing
Dict Speed Usage R/U Rating | Speed Usage R/U Rating
KiB/s % MIPS MIPS | KiB/s % MIPS MIPS
22: 917 100 892 892 | 17497 100 1494 1494
23: 875 100 892 892 | 17175 100 1487 1487
24: 848 100 912 912 | 16820 100 1477 1477
25: 820 100 936 936 | 16412 100 1461 1461
---------------------------------- | ------------------------------
Avr: 100 908 908 | 100 1480 1480
Tot: 100 1194 1194
##########################################################################
Executing benchmark 3 times multi-threaded on CPUs 0-3
7-Zip (a) 16.02 : Copyright (c) 1999-2016 Igor Pavlov : 2016-05-21
p7zip Version 16.02 (locale=C,Utf16=off,HugeFiles=on,64 bits,4 CPUs LE)
LE
CPU Freq: 64000000 64000000 - - 128000000 256000000 512000000 1024000000 2048000000
RAM size: 3891 MB, # CPU hardware threads: 4
RAM usage: 882 MB, # Benchmark threads: 4
Compressing | Decompressing
Dict Speed Usage R/U Rating | Speed Usage R/U Rating
KiB/s % MIPS MIPS | KiB/s % MIPS MIPS
22: 1753 214 799 1706 | 67832 398 1452 5787
23: 2599 339 782 2649 | 66677 400 1444 5769
24: 2572 351 789 2766 | 64957 399 1429 5702
25: 2028 284 816 2317 | 63431 399 1414 5645
---------------------------------- | ------------------------------
Avr: 297 796 2359 | 399 1435 5726
Tot: 348 1116 4043
7-Zip (a) 16.02 : Copyright (c) 1999-2016 Igor Pavlov : 2016-05-21
p7zip Version 16.02 (locale=C,Utf16=off,HugeFiles=on,64 bits,4 CPUs LE)
LE
CPU Freq: - - - - - 256000000 - - -
RAM size: 3891 MB, # CPU hardware threads: 4
RAM usage: 882 MB, # Benchmark threads: 4
Compressing | Decompressing
Dict Speed Usage R/U Rating | Speed Usage R/U Rating
KiB/s % MIPS MIPS | KiB/s % MIPS MIPS
22: 2651 331 779 2579 | 68173 400 1455 5816
23: 2584 337 782 2633 | 66586 399 1442 5761
24: 2563 348 792 2756 | 65197 400 1432 5723
25: 2319 327 811 2648 | 63439 399 1414 5646
---------------------------------- | ------------------------------
Avr: 336 791 2654 | 400 1436 5737
Tot: 368 1113 4196
7-Zip (a) 16.02 : Copyright (c) 1999-2016 Igor Pavlov : 2016-05-21
p7zip Version 16.02 (locale=C,Utf16=off,HugeFiles=on,64 bits,4 CPUs LE)
LE
CPU Freq: - - - - - 256000000 - 1024000000 -
RAM size: 3891 MB, # CPU hardware threads: 4
RAM usage: 882 MB, # Benchmark threads: 4
Compressing | Decompressing
Dict Speed Usage R/U Rating | Speed Usage R/U Rating
KiB/s % MIPS MIPS | KiB/s % MIPS MIPS
22: 2453 303 788 2387 | 68047 399 1454 5806
23: 2612 340 783 2662 | 66455 399 1441 5750
24: 2527 344 791 2718 | 64923 399 1428 5699
25: 2526 360 802 2884 | 63395 399 1413 5642
---------------------------------- | ------------------------------
Avr: 337 791 2663 | 399 1434 5724
Tot: 368 1113 4194
Compression: 2359,2654,2663
Decompression: 5726,5737,5724
Total: 4043,4196,4194
##########################################################################
Testing maximum cpufreq again, still under full load. System health now:
Time CPU load %cpu %sys %usr %nice %io %irq Temp
13:37:36: 1500MHz 4.14 97% 1% 96% 0% 0% 0% 66.5°C
Checking cpufreq OPP (sifive,u74-mc):
Cpufreq OPP: 1500 Measured: 1498 (1498.896/1498.800/1498.762)
##########################################################################
Hardware sensors:
120e0000.tmon-isa-0000
temp1: +64.5 C
##########################################################################
Thermal source: /sys/devices/virtual/thermal/thermal_zone0/ (cpu-thermal)
System health while running tinymembench:
Time CPU load %cpu %sys %usr %nice %io %irq Temp
13:26:54: 1500MHz 0.35 10% 2% 4% 0% 2% 0% 52.2°C
13:27:04: 1500MHz 0.45 25% 0% 25% 0% 0% 0% 54.8°C
13:27:14: 1500MHz 0.61 25% 0% 25% 0% 0% 0% 55.5°C
13:27:24: 1500MHz 0.70 25% 0% 25% 0% 0% 0% 56.1°C
System health while running ramlat:
Time CPU load %cpu %sys %usr %nice %io %irq Temp
13:27:35: 1500MHz 0.74 12% 2% 7% 0% 2% 0% 55.9°C
13:27:38: 1500MHz 0.74 25% 0% 25% 0% 0% 0% 55.8°C
13:27:41: 1500MHz 0.76 25% 0% 24% 0% 0% 0% 55.9°C
13:27:44: 1500MHz 0.76 25% 0% 25% 0% 0% 0% 56.0°C
13:27:47: 1500MHz 0.78 25% 0% 25% 0% 0% 0% 56.1°C
13:27:50: 1500MHz 0.80 25% 0% 25% 0% 0% 0% 56.2°C
13:27:53: 1500MHz 0.80 25% 0% 24% 0% 0% 0% 56.1°C
13:27:56: 1500MHz 0.82 25% 0% 24% 0% 0% 0% 56.0°C
13:27:59: 1500MHz 0.83 25% 0% 24% 0% 0% 0% 56.0°C
13:28:02: 1500MHz 0.83 25% 0% 24% 0% 0% 0% 56.0°C
13:28:05: 1500MHz 0.85 25% 0% 25% 0% 0% 0% 56.0°C
13:28:08: 1500MHz 0.85 25% 0% 24% 0% 0% 0% 56.1°C
13:28:11: 1500MHz 0.86 25% 1% 24% 0% 0% 0% 56.2°C
13:28:14: 1500MHz 0.87 25% 0% 25% 0% 0% 0% 56.2°C
System health while running OpenSSL benchmark:
Time CPU load %cpu %sys %usr %nice %io %irq Temp
13:28:15: 1500MHz 0.87 14% 2% 9% 0% 2% 0% 56.6°C
13:28:32: 1500MHz 0.90 25% 0% 25% 0% 0% 0% 57.0°C
13:28:48: 1500MHz 0.92 25% 0% 25% 0% 0% 0% 57.1°C
13:29:04: 1500MHz 0.94 25% 0% 25% 0% 0% 0% 57.5°C
13:29:20: 1500MHz 0.96 25% 0% 25% 0% 0% 0% 57.5°C
13:29:36: 1500MHz 0.97 25% 0% 25% 0% 0% 0% 57.8°C
13:29:52: 1500MHz 0.98 25% 0% 25% 0% 0% 0% 57.9°C
System health while running 7-zip single core benchmark:
Time CPU load %cpu %sys %usr %nice %io %irq Temp
13:30:04: 1500MHz 0.98 16% 1% 13% 0% 1% 0% 58.2°C
13:30:15: 1500MHz 0.98 25% 0% 24% 0% 0% 0% 58.0°C
13:30:26: 1500MHz 0.99 25% 0% 24% 0% 0% 0% 58.1°C
13:30:37: 1500MHz 1.07 25% 0% 24% 0% 0% 0% 58.2°C
13:30:48: 1500MHz 1.06 25% 0% 24% 0% 0% 0% 58.3°C
13:30:59: 1500MHz 1.05 25% 0% 24% 0% 0% 0% 58.4°C
13:31:10: 1500MHz 1.04 25% 0% 24% 0% 0% 0% 58.5°C
13:31:21: 1500MHz 1.11 25% 0% 24% 0% 0% 0% 58.6°C
13:31:32: 1500MHz 1.09 25% 0% 24% 0% 0% 0% 58.7°C
13:31:44: 1500MHz 1.08 25% 0% 24% 0% 0% 0% 58.8°C
13:31:55: 1500MHz 1.06 25% 0% 24% 0% 0% 0% 58.8°C
13:32:06: 1500MHz 1.05 25% 0% 24% 0% 0% 0% 58.8°C
System health while running 7-zip multi core benchmark:
Time CPU load %cpu %sys %usr %nice %io %irq Temp
13:32:12: 1500MHz 1.04 18% 1% 15% 0% 1% 0% 59.0°C
13:32:37: 1500MHz 1.83 63% 0% 63% 0% 0% 0% 61.7°C
13:33:00: 1500MHz 2.27 93% 0% 93% 0% 0% 0% 62.5°C
13:33:24: 1500MHz 2.63 93% 1% 91% 0% 0% 0% 63.8°C
13:33:46: 1500MHz 2.99 80% 1% 78% 0% 0% 0% 63.1°C
13:34:08: 1500MHz 3.21 72% 0% 71% 0% 0% 0% 63.7°C
13:34:31: 1500MHz 3.56 90% 0% 90% 0% 0% 0% 64.6°C
13:34:53: 1500MHz 3.69 90% 1% 89% 0% 0% 0% 64.8°C
13:35:15: 1500MHz 3.77 90% 1% 89% 0% 0% 0% 65.0°C
13:35:37: 1500MHz 3.84 88% 1% 87% 0% 0% 0% 64.9°C
13:36:00: 1500MHz 3.83 79% 0% 78% 0% 0% 0% 64.9°C
13:36:25: 1500MHz 3.78 90% 0% 90% 0% 0% 0% 65.5°C
13:36:50: 1500MHz 3.77 91% 1% 90% 0% 0% 0% 65.7°C
13:37:13: 1500MHz 3.83 88% 1% 87% 0% 0% 0% 65.8°C
13:37:36: 1500MHz 4.14 97% 1% 96% 0% 0% 0% 66.5°C
##########################################################################
Linux 5.15.0-starfive (starfive) 07/08/23 _riscv64_ (4 CPU)
avg-cpu: %user %nice %system %iowait %steal %idle
40.28 0.01 1.29 0.93 0.00 57.48
Device tps kB_read/s kB_wrtn/s kB_dscd/s kB_read kB_wrtn kB_dscd
mmcblk1 10.33 373.11 31.72 0.00 344205 29265 0
total used free shared buff/cache available
Mem: 3.8Gi 126Mi 3.6Gi 3.0Mi 71Mi 3.7Gi
Swap: 0B 0B 0B
CPU sysfs topology (clusters, cpufreq members, clockspeeds)
cpufreq min max
CPU cluster policy speed speed core type
0 0 0 375 1500 sifive,u74-mc
1 0 0 375 1500 sifive,u74-mc
2 0 0 375 1500 sifive,u74-mc
3 0 0 375 1500 sifive,u74-mc
Architecture: riscv64
Byte Order: Little Endian
CPU(s): 4
On-line CPU(s) list: 0-3
SoC guess: StarFive JH7110
DT compat: starfive,visionfive-v2
starfive,jh7110
Compiler: /usr/bin/gcc (Debian 12.3.0-4) 12.3.0 / riscv64-linux-gnu
Userland: riscv64
Kernel: 5.15.0-starfive/riscv64
CONFIG_HZ=100
CONFIG_HZ_100=y
CONFIG_PREEMPT_COUNT=y
CONFIG_PREEMPT_NONE=y
##########################################################################
Kernel 5.15.0 is not latest 5.15.120 LTS that was released on 2023-07-05.
See https://endoflife.date/linux for details. It is somewhat likely that
a lot of exploitable vulnerabilities exist for this kernel as well as many
unfixed bugs.
But this version string doesn't matter since this is not an official LTS Linux
from kernel.org. This device runs a StarFive vendor/BSP kernel.
##########################################################################
cpu0/index0: 32K, level: 1, type: Instruction
cpu0/index1: 32K, level: 1, type: Data
cpu0/index2: 2048K, level: 2, type: Unified
cpu1/index0: 32K, level: 1, type: Instruction
cpu1/index1: 32K, level: 1, type: Data
cpu1/index2: 2048K, level: 2, type: Unified
cpu2/index0: 32K, level: 1, type: Instruction
cpu2/index1: 32K, level: 1, type: Data
cpu2/index2: 2048K, level: 2, type: Unified
cpu3/index0: 32K, level: 1, type: Instruction
cpu3/index1: 32K, level: 1, type: Data
cpu3/index2: 2048K, level: 2, type: Unified
##########################################################################
cpu_vdd: 1040 mV (1540 mV max)
opp-table-0:
375 MHz 800.0 mV
500 MHz 800.0 mV
750 MHz 800.0 mV
1500 MHz 1040.0 mV
##########################################################################
Results validation:
* Measured clockspeed not lower than advertised max CPU clockspeed
* Background activity (%system) OK
* No throttling
| StarFive VisionFive V2 | 1500 MHz | 5.15 | Debian GNU/Linux trixie/sid riscv64 | 4140 | 1194 | 25040 | 950 | 900 | - |
```
Full Result
```
sbc-bench v0.9.61 RPi 4 Model B Rev 1.5 / BCM2711 Rev C0 or later (Fri, 02 Feb 2024 12:08:33 +0100)
Distributor ID: Debian
Description: Debian GNU/Linux 12 (bookworm)
Release: 12
Codename: bookworm
Build system: bookworm main
Warning: this Raspberry Pi is powered by BCM2711 Rev. C0 or later but arm_boost=1
is not set in /boot/config.txt. Some (mis)information about what you are missing:
https://www.raspberrypi.com/news/bullseye-bonus-1-8ghz-raspberry-pi-4/
Raspberry Pi ThreadX version:
Oct 17 2023 15:39:30
Copyright (c) 2012 Broadcom
version 30f0c5e4d076da3ab4f341d88e7d505760b93ad7 (clean) (release) (start_cd)
ThreadX configuration (/boot/config.txt):
DO NOT EDIT THIS FILE
The file you are looking for has moved to /boot/firmware/config.txt
Actual ThreadX settings:
arm_64bit=1
arm_boost=1
arm_freq=1800
audio_pwm_mode=514
camera_auto_detect=-1
config_hdmi_boost=5
core_freq=500
core_freq_min=200
disable_commandline_tags=2
disable_l2cache=1
disable_overscan=1
disable_splash=1
display_auto_detect=1
display_default_lcd=1
display_hdmi_rotate=-1
display_lcd_rotate=-1
dvfs=3
enable_gic=1
enable_uart=1
force_eeprom_read=1
force_pwm_open=1
framebuffer_depth=16
framebuffer_ignore_alpha=1
framebuffer_swap=1
gpu_freq=500
gpu_freq_min=250
hdmi_blanking=2
init_uart_clock=0x2dc6c00
lcd_framerate=60
mask_gpu_interrupt0=3072
mask_gpu_interrupt1=29731
max_framebuffers=2
pause_burst_frames=1
pciex4_reset=1
program_serial_random=1
total_mem=2048
hdmi_force_cec_address:0=65535
hdmi_force_cec_address:1=65535
hdmi_pixel_freq_limit:0=0x11e1a300
hdmi_pixel_freq_limit:1=0x11e1a300
/usr/bin/gcc (Debian 12.2.0-14) 12.2.0
Uptime: 12:08:33 up 18 min, 1 user, load average: 0.11, 0.98, 0.88, 45.8°C, 178934940
Linux 6.1.0-rpi8-rpi-v8 (raspberry4) 02/02/24 _aarch64_ (4 CPU)
avg-cpu: %user %nice %system %iowait %steal %idle
26.76 0.01 1.11 0.86 0.00 71.26
Device tps kB_read/s kB_wrtn/s kB_dscd/s kB_read kB_wrtn kB_dscd
mmcblk0 16.91 919.11 29.47 0.00 1041588 33394 0
total used free shared buff/cache available
Mem: 1.9Gi 272Mi 1.5Gi 7.6Mi 185Mi 1.6Gi
Swap: 99Mi 0B 99Mi
Filename Type Size Used Priority
/var/swap file 102396 0 -2
##########################################################################
Checking cpufreq OPP (Cortex-A72):
Cpufreq OPP: 1800 ThreadX: 1800 Measured: 1797 @ 0.9500V
Cpufreq OPP: 1700 ThreadX: 1700 Measured: 1697 @ 0.9300V
Cpufreq OPP: 1600 ThreadX: 1600 Measured: 1597 @ 0.9100V
Cpufreq OPP: 1500 ThreadX: 1500 Measured: 1497 @ 0.8800V
Cpufreq OPP: 1400 ThreadX: 1400 Measured: 1397 @ 0.8800V
Cpufreq OPP: 1300 ThreadX: 1300 Measured: 1297 @ 0.8800V
Cpufreq OPP: 1200 ThreadX: 1200 Measured: 1197 @ 0.8800V
Cpufreq OPP: 1100 ThreadX: 1100 Measured: 1097 @ 0.8800V
Cpufreq OPP: 1000 ThreadX: 1000 Measured: 997 @ 0.8800V
Cpufreq OPP: 900 ThreadX: 900 Measured: 897 @ 0.8800V
Cpufreq OPP: 800 ThreadX: 800 Measured: 797 @ 0.8800V
Cpufreq OPP: 700 ThreadX: 700 Measured: 697 @ 0.8800V
Cpufreq OPP: 600 ThreadX: 600 Measured: 597 @ 0.8800V
##########################################################################
Hardware sensors:
cpu_thermal-virtual-0
temp1: +46.3 C (crit = +110.0 C)
##########################################################################
Executing benchmark on cpu0 (Cortex-A72):
tinymembench v0.4.9-nuumio (simple benchmark for memory throughput and latency)
CFLAGS:
bandwidth test min repeats (-b): 2
bandwidth test max repeats (-B): 3
bandwidth test mem realloc (-M): no (-m for realloc)
latency test repeats (-l): 3
latency test count (-c): 1000000
==========================================================================
== Memory bandwidth tests ==
== ==
== Note 1: 1MB = 1000000 bytes ==
== Note 2: Test result is the best of repeated runs. Number of repeats ==
== is shown in brackets ==
== Note 3: Results for 'copy' tests show how many bytes can be ==
== copied per second (adding together read and writen ==
== bytes would have provided twice higher numbers) ==
== Note 4: 2-pass copy means that we are using a small temporary buffer ==
== to first fetch data into it, and only then write it to the ==
== destination (source -> L1 cache, L1 cache -> destination) ==
== Note 5: If sample standard deviation exceeds 0.1%, it is shown in ==
== brackets ==
==========================================================================
C copy backwards : 2458.1 MB/s (3, 14.0%)
C copy backwards (32 byte blocks) : 2500.0 MB/s (2)
C copy backwards (64 byte blocks) : 2499.0 MB/s (2)
C copy : 2462.4 MB/s (2)
C copy prefetched (32 bytes step) : 2457.2 MB/s (2)
C copy prefetched (64 bytes step) : 2457.9 MB/s (2)
C 2-pass copy : 2052.8 MB/s (3, 2.1%)
C 2-pass copy prefetched (32 bytes step) : 2152.7 MB/s (2)
C 2-pass copy prefetched (64 bytes step) : 2139.4 MB/s (3)
C scan 8 : 890.0 MB/s (2)
C scan 16 : 1677.2 MB/s (3, 0.3%)
C scan 32 : 3242.0 MB/s (3, 1.4%)
C scan 64 : 3958.3 MB/s (3)
C fill : 3028.8 MB/s (3, 0.2%)
C fill (shuffle within 16 byte blocks) : 3044.4 MB/s (3, 0.2%)
C fill (shuffle within 32 byte blocks) : 3050.0 MB/s (3, 0.1%)
C fill (shuffle within 64 byte blocks) : 3049.9 MB/s (3, 1.2%)
---
libc memcpy copy : 2469.6 MB/s (3, 0.2%)
libc memchr scan : 3952.2 MB/s (2)
libc memset fill : 3045.1 MB/s (3, 0.4%)
---
NEON LDP/STP copy : 2460.4 MB/s (3, 0.1%)
NEON LDP/STP copy pldl2strm (32 bytes step) : 2436.7 MB/s (3, 2.2%)
NEON LDP/STP copy pldl2strm (64 bytes step) : 2440.7 MB/s (3, 0.1%)
NEON LDP/STP copy pldl1keep (32 bytes step) : 2463.3 MB/s (2)
NEON LDP/STP copy pldl1keep (64 bytes step) : 2461.8 MB/s (2)
NEON LD1/ST1 copy : 2457.5 MB/s (3, 1.9%)
NEON LDP load : 3978.8 MB/s (2)
NEON LDNP load : 3958.3 MB/s (2)
NEON STP fill : 3034.0 MB/s (3, 0.4%)
NEON STNP fill : 2681.3 MB/s (2)
ARM LDP/STP copy : 2456.3 MB/s (2)
ARM LDP load : 3978.0 MB/s (2)
ARM LDNP load : 4036.3 MB/s (3, 3.9%)
ARM STP fill : 3039.3 MB/s (3, 0.5%)
ARM STNP fill : 2700.4 MB/s (3, 0.6%)
==========================================================================
== Framebuffer read tests. ==
== ==
== Many ARM devices use a part of the system memory as the framebuffer, ==
== typically mapped as uncached but with write-combining enabled. ==
== Writes to such framebuffers are quite fast, but reads are much ==
== slower and very sensitive to the alignment and the selection of ==
== CPU instructions which are used for accessing memory. ==
== ==
== Many x86 systems allocate the framebuffer in the GPU memory, ==
== accessible for the CPU via a relatively slow PCI-E bus. Moreover, ==
== PCI-E is asymmetric and handles reads a lot worse than writes. ==
== ==
== If uncached framebuffer reads are reasonably fast (at least 100 MB/s ==
== or preferably >300 MB/s), then using the shadow framebuffer layer ==
== is not necessary in Xorg DDX drivers, resulting in a nice overall ==
== performance improvement. For example, the xf86-video-fbturbo DDX ==
== uses this trick. ==
==========================================================================
NEON LDP/STP copy (from framebuffer) : 787.8 MB/s (3, 1.4%)
NEON LDP/STP 2-pass copy (from framebuffer) : 702.7 MB/s (3, 0.1%)
NEON LD1/ST1 copy (from framebuffer) : 818.4 MB/s (3, 0.7%)
NEON LD1/ST1 2-pass copy (from framebuffer) : 735.7 MB/s (3, 0.3%)
ARM LDP/STP copy (from framebuffer) : 568.8 MB/s (3, 1.5%)
ARM LDP/STP 2-pass copy (from framebuffer) : 563.8 MB/s (3, 0.4%)
==========================================================================
== Memory latency test ==
== ==
== Average time is measured for random memory accesses in the buffers ==
== of different sizes. The larger is the buffer, the more significant ==
== are relative contributions of TLB, L1/L2 cache misses and SDRAM ==
== accesses. For extremely large buffer sizes we are expecting to see ==
== page table walk with several requests to SDRAM for almost every ==
== memory access (though 64MiB is not nearly large enough to experience ==
== this effect to its fullest). ==
== ==
== Note 1: All the numbers are representing extra time, which needs to ==
== be added to L1 cache latency. The cycle timings for L1 cache ==
== latency can be usually found in the processor documentation. ==
== Note 2: Dual random read means that we are simultaneously performing ==
== two independent memory accesses at a time. In the case if ==
== the memory subsystem can't handle multiple outstanding ==
== requests, dual random read has the same timings as two ==
== single reads performed one after another. ==
==========================================================================
block size : single random read / dual random read
1024 : 0.0 ns / 0.0 ns
2048 : 0.0 ns / 0.0 ns
4096 : 0.0 ns / 0.0 ns
8192 : 0.0 ns / 0.0 ns
16384 : 0.0 ns / 0.0 ns
32768 : 0.0 ns / 0.0 ns
65536 : 4.8 ns / 7.4 ns
131072 : 7.3 ns / 9.9 ns
262144 : 10.5 ns / 13.2 ns
524288 : 12.5 ns / 15.1 ns
1048576 : 25.5 ns / 39.9 ns
2097152 : 82.5 ns / 119.6 ns
4194304 : 110.2 ns / 143.1 ns
8388608 : 130.8 ns / 164.4 ns
16777216 : 141.1 ns / 175.2 ns
33554432 : 146.6 ns / 181.4 ns
67108864 : 157.5 ns / 201.3 ns
##########################################################################
Executing ramlat on cpu0 (Cortex-A72), results in ns:
size: 1x32 2x32 1x64 2x64 1xPTR 2xPTR 4xPTR 8xPTR
4k: 2.817 2.792 2.793 2.790 2.227 2.225 2.225 4.451
8k: 2.784 2.782 2.782 2.791 2.226 2.226 2.231 4.451
16k: 7.566 8.465 7.517 8.416 7.159 8.211 9.116 14.81
32k: 10.17 10.22 10.16 10.22 9.442 10.02 15.33 30.24
64k: 11.10 11.20 11.06 11.24 10.50 11.00 17.70 35.19
128k: 12.25 12.29 12.26 12.29 11.68 12.65 20.62 40.23
256k: 17.17 17.15 17.18 17.14 16.61 16.49 20.96 40.15
512k: 17.22 17.06 17.19 17.09 21.97 16.68 20.93 40.16
1024k: 58.70 58.33 66.02 60.31 66.12 63.73 74.69 98.63
2048k: 134.7 143.6 141.3 140.4 138.8 117.8 133.9 168.5
4096k: 129.6 130.0 135.5 136.3 136.1 129.7 140.7 186.5
8192k: 151.2 153.6 153.4 154.3 153.5 153.7 154.3 191.0
16384k: 153.3 154.6 154.2 154.6 154.1 155.4 165.3 196.9
32768k: 155.3 155.2 154.0 155.2 154.0 158.4 163.6 199.5
65536k: 169.9 168.5 166.6 168.1 167.2 172.6 183.0 209.2
131072k: 172.4 169.1 167.4 169.0 168.0 172.7 184.9 231.6
##########################################################################
Executing benchmark twice on cluster 0 (Cortex-A72)
OpenSSL 3.0.11, built on 19 Sep 2023 (Library: OpenSSL 3.0.11 19 Sep 2023)
type 16 bytes 64 bytes 256 bytes 1024 bytes 8192 bytes 16384 bytes
aes-128-cbc 44875.06k 48773.55k 50142.72k 50492.76k 50591.06k 50599.25k
aes-128-cbc 44948.67k 48802.62k 50171.65k 50501.29k 50604.71k 50621.10k
aes-192-cbc 38123.15k 40896.11k 42053.03k 42355.37k 42262.53k 42259.80k
aes-192-cbc 38163.97k 40942.44k 42080.51k 42372.10k 42472.79k 42308.95k
aes-256-cbc 33106.75k 35206.59k 35980.80k 36156.07k 36211.37k 36225.02k
aes-256-cbc 33166.04k 35246.19k 36000.34k 36172.12k 36241.41k 36241.41k
##########################################################################
Executing benchmark single-threaded on cpu0 (Cortex-A72)
7-Zip (a) [64] 16.02 : Copyright (c) 1999-2016 Igor Pavlov : 2016-05-21
p7zip Version 16.02 (locale=C,Utf16=off,HugeFiles=on,64 bits,4 CPUs LE)
LE
CPU Freq: - - - 64000000 128000000 - - - -
RAM size: 1898 MB, # CPU hardware threads: 4
RAM usage: 435 MB, # Benchmark threads: 1
Compressing | Decompressing
Dict Speed Usage R/U Rating | Speed Usage R/U Rating
KiB/s % MIPS MIPS | KiB/s % MIPS MIPS
22: 1621 100 1581 1577 | 22734 100 1943 1941
23: 1582 100 1614 1612 | 22350 100 1937 1935
24: 1493 100 1608 1606 | 21951 100 1930 1927
25: 1395 100 1596 1593 | 21464 100 1913 1910
---------------------------------- | ------------------------------
Avr: 100 1600 1597 | 100 1931 1928
Tot: 100 1765 1763
##########################################################################
Executing benchmark 3 times multi-threaded on CPUs 0-3
7-Zip (a) [64] 16.02 : Copyright (c) 1999-2016 Igor Pavlov : 2016-05-21
p7zip Version 16.02 (locale=C,Utf16=off,HugeFiles=on,64 bits,4 CPUs LE)
LE
CPU Freq: - - - - - - - - 2048000000
RAM size: 1898 MB, # CPU hardware threads: 4
RAM usage: 882 MB, # Benchmark threads: 4
Compressing | Decompressing
Dict Speed Usage R/U Rating | Speed Usage R/U Rating
KiB/s % MIPS MIPS | KiB/s % MIPS MIPS
22: 4144 351 1150 4031 | 88020 398 1886 7510
23: 3892 353 1123 3966 | 86541 399 1878 7488
24: 3800 361 1132 4086 | 84796 399 1868 7444
25: 3666 365 1147 4187 | 82863 399 1850 7375
---------------------------------- | ------------------------------
Avr: 358 1138 4068 | 398 1871 7454
Tot: 378 1504 5761
7-Zip (a) [64] 16.02 : Copyright (c) 1999-2016 Igor Pavlov : 2016-05-21
p7zip Version 16.02 (locale=C,Utf16=off,HugeFiles=on,64 bits,4 CPUs LE)
LE
CPU Freq: - - - - - - - - -
RAM size: 1898 MB, # CPU hardware threads: 4
RAM usage: 882 MB, # Benchmark threads: 4
Compressing | Decompressing
Dict Speed Usage R/U Rating | Speed Usage R/U Rating
KiB/s % MIPS MIPS | KiB/s % MIPS MIPS
22: 4130 349 1153 4018 | 87878 398 1885 7497
23: 3994 363 1120 4070 | 86147 397 1876 7454
24: 3830 364 1130 4118 | 84673 398 1866 7433
25: 3678 369 1139 4200 | 82844 399 1850 7373
---------------------------------- | ------------------------------
Avr: 361 1136 4101 | 398 1869 7439
Tot: 380 1502 5770
7-Zip (a) [64] 16.02 : Copyright (c) 1999-2016 Igor Pavlov : 2016-05-21
p7zip Version 16.02 (locale=C,Utf16=off,HugeFiles=on,64 bits,4 CPUs LE)
LE
CPU Freq: - - - - - - - - -
RAM size: 1898 MB, # CPU hardware threads: 4
RAM usage: 882 MB, # Benchmark threads: 4
Compressing | Decompressing
Dict Speed Usage R/U Rating | Speed Usage R/U Rating
KiB/s % MIPS MIPS | KiB/s % MIPS MIPS
22: 4125 349 1150 4013 | 88221 399 1888 7527
23: 3919 357 1117 3993 | 86476 398 1878 7482
24: 3880 371 1125 4172 | 84615 398 1867 7428
25: 3681 372 1131 4203 | 82807 398 1852 7370
---------------------------------- | ------------------------------
Avr: 362 1131 4095 | 398 1871 7452
Tot: 380 1501 5774
Compression: 4068,4101,4095
Decompression: 7454,7439,7452
Total: 5761,5770,5774
##########################################################################
Testing maximum cpufreq again, still under full load. System health now:
Time fake/real load %cpu %sys %usr %nice %io %irq Temp VCore
12:18:14: 1800/1800MHz 4.09 91% 2% 88% 0% 0% 0% 69.6°C 0.9500V
Checking cpufreq OPP (Cortex-A72):
Cpufreq OPP: 1800 ThreadX: 1800 Measured: 1797 @ 0.9500V
##########################################################################
Hardware sensors:
cpu_thermal-virtual-0
temp1: +66.7 C (crit = +110.0 C)
##########################################################################
Thermal source: /sys/devices/virtual/thermal/thermal_zone0/ (cpu-thermal)
System health while running tinymembench:
Time fake/real load %cpu %sys %usr %nice %io %irq Temp VCore
12:09:34: 1800/1800MHz 0.68 28% 1% 26% 0% 0% 0% 47.7°C 0.9500V
12:09:44: 1800/1800MHz 0.73 25% 0% 25% 0% 0% 0% 49.7°C 0.9500V
12:09:54: 1800/1800MHz 0.77 25% 0% 25% 0% 0% 0% 50.1°C 0.9500V
12:10:04: 1800/1800MHz 0.80 25% 0% 25% 0% 0% 0% 50.1°C 0.9500V
12:10:15: 1800/1800MHz 0.83 25% 0% 25% 0% 0% 0% 51.1°C 0.9500V
12:10:25: 1800/1800MHz 0.86 25% 0% 25% 0% 0% 0% 51.6°C 0.9500V
12:10:35: 1800/1800MHz 0.88 25% 0% 25% 0% 0% 0% 51.6°C 0.9500V
12:10:45: 1800/1800MHz 0.90 25% 0% 25% 0% 0% 0% 51.1°C 0.9500V
12:10:55: 1800/1800MHz 0.92 25% 0% 24% 0% 0% 0% 51.1°C 0.9500V
System health while running ramlat:
Time fake/real load %cpu %sys %usr %nice %io %irq Temp VCore
12:11:01: 1800/1800MHz 0.92 28% 1% 26% 0% 0% 0% 50.6°C 0.9500V
12:11:04: 1800/1800MHz 0.93 25% 0% 25% 0% 0% 0% 51.1°C 0.9500V
12:11:07: 1800/1800MHz 0.94 25% 0% 24% 0% 0% 0% 50.6°C 0.9500V
12:11:10: 1800/1800MHz 0.94 25% 0% 25% 0% 0% 0% 50.6°C 0.9500V
12:11:13: 1800/1800MHz 0.94 25% 0% 25% 0% 0% 0% 50.6°C 0.9500V
12:11:16: 1800/1800MHz 0.94 25% 0% 25% 0% 0% 0% 50.1°C 0.9500V
12:11:19: 1800/1800MHz 0.95 25% 0% 25% 0% 0% 0% 50.6°C 0.9500V
12:11:22: 1800/1800MHz 0.95 25% 0% 25% 0% 0% 0% 50.6°C 0.9500V
12:11:25: 1800/1800MHz 0.95 25% 0% 24% 0% 0% 0% 51.6°C 0.9500V
12:11:28: 1800/1800MHz 0.95 25% 0% 24% 0% 0% 0% 51.6°C 0.9500V
12:11:31: 1800/1800MHz 0.96 25% 1% 24% 0% 0% 0% 50.1°C 0.9500V
12:11:34: 1800/1800MHz 0.96 25% 0% 24% 0% 0% 0% 50.6°C 0.9500V
System health while running OpenSSL benchmark:
Time fake/real load %cpu %sys %usr %nice %io %irq Temp VCore
12:11:35: 1800/1800MHz 0.96 28% 1% 26% 0% 0% 0% 52.1°C 0.9500V
12:11:51: 1800/1800MHz 0.97 25% 0% 25% 0% 0% 0% 52.6°C 0.9500V
12:12:07: 1800/1800MHz 0.98 25% 0% 25% 0% 0% 0% 51.6°C 0.9500V
12:12:23: 1800/1800MHz 0.98 25% 0% 25% 0% 0% 0% 52.1°C 0.9500V
12:12:39: 1800/1800MHz 0.99 25% 0% 25% 0% 0% 0% 52.6°C 0.9500V
12:12:55: 1800/1800MHz 0.99 25% 0% 25% 0% 0% 0% 52.1°C 0.9500V
12:13:11: 1800/1800MHz 0.99 25% 0% 25% 0% 0% 0% 52.6°C 0.9500V
System health while running 7-zip single core benchmark:
Time fake/real load %cpu %sys %usr %nice %io %irq Temp VCore
12:13:23: 1800/1800MHz 1.00 28% 0% 26% 0% 0% 0% 53.1°C 0.9500V
12:13:29: 1800/1800MHz 1.00 25% 0% 24% 0% 0% 0% 52.1°C 0.9500V
12:13:35: 1800/1800MHz 1.00 25% 0% 24% 0% 0% 0% 53.6°C 0.9500V
12:13:41: 1800/1800MHz 1.00 25% 0% 24% 0% 0% 0% 52.6°C 0.9500V
12:13:47: 1800/1800MHz 1.00 25% 0% 24% 0% 0% 0% 53.6°C 0.9500V
12:13:53: 1800/1800MHz 1.00 25% 0% 25% 0% 0% 0% 52.1°C 0.9500V
12:13:59: 1800/1800MHz 1.00 25% 0% 24% 0% 0% 0% 53.1°C 0.9500V
12:14:05: 1800/1800MHz 1.00 25% 0% 24% 0% 0% 0% 53.6°C 0.9500V
12:14:11: 1800/1800MHz 1.00 25% 0% 25% 0% 0% 0% 52.6°C 0.9500V
12:14:18: 1800/1800MHz 1.00 25% 0% 24% 0% 0% 0% 53.6°C 0.9500V
12:14:24: 1800/1800MHz 1.00 25% 0% 24% 0% 0% 0% 53.1°C 0.9500V
12:14:30: 1800/1800MHz 1.00 25% 0% 24% 0% 0% 0% 53.1°C 0.9500V
12:14:36: 1800/1800MHz 1.00 25% 0% 24% 0% 0% 0% 53.1°C 0.9500V
12:14:42: 1800/1800MHz 1.00 25% 0% 24% 0% 0% 0% 52.6°C 0.9500V
System health while running 7-zip multi core benchmark:
Time fake/real load %cpu %sys %usr %nice %io %irq Temp VCore
12:14:45: 1800/1800MHz 1.00 27% 0% 26% 0% 0% 0% 53.6°C 0.9500V
12:15:01: 1800/1800MHz 1.60 90% 0% 89% 0% 0% 0% 61.8°C 0.9500V
12:15:14: 1800/1800MHz 2.13 95% 0% 94% 0% 0% 0% 63.8°C 0.9500V
12:15:32: 1800/1800MHz 2.48 92% 1% 90% 0% 0% 0% 64.8°C 0.9500V
12:15:46: 1800/1800MHz 2.96 89% 2% 87% 0% 0% 0% 64.3°C 0.9500V
12:15:59: 1800/1800MHz 3.19 96% 1% 94% 0% 0% 0% 65.2°C 0.9500V
12:16:14: 1800/1800MHz 3.37 94% 1% 93% 0% 0% 0% 68.7°C 0.9500V
12:16:27: 1800/1800MHz 3.58 96% 1% 94% 0% 0% 0% 69.6°C 0.9500V
12:16:45: 1800/1800MHz 3.72 92% 2% 90% 0% 0% 0% 70.1°C 0.9500V
12:17:01: 1800/1800MHz 4.00 90% 2% 88% 0% 0% 0% 68.2°C 0.9500V
12:17:14: 1800/1800MHz 4.14 96% 1% 94% 0% 0% 0% 69.1°C 0.9500V
12:17:27: 1800/1800MHz 4.11 95% 0% 95% 0% 0% 0% 71.1°C 0.9500V
12:17:41: 1800/1800MHz 3.94 95% 0% 94% 0% 0% 0% 72.1°C 0.9500V
12:17:58: 1800/1800MHz 3.82 93% 2% 91% 0% 0% 0% 73.0°C 0.9500V
12:18:14: 1800/1800MHz 4.09 91% 2% 88% 0% 0% 0% 69.6°C 0.9500V
##########################################################################
Linux 6.1.0-rpi8-rpi-v8 (raspberry4) 02/02/24 _aarch64_ (4 CPU)
avg-cpu: %user %nice %system %iowait %steal %idle
34.66 0.02 1.05 0.57 0.00 63.70
Device tps kB_read/s kB_wrtn/s kB_dscd/s kB_read kB_wrtn kB_dscd
mmcblk0 11.45 608.57 20.81 0.00 1052632 35990 0
total used free shared buff/cache available
Mem: 1.9Gi 275Mi 1.5Gi 7.5Mi 196Mi 1.6Gi
Swap: 99Mi 0B 99Mi
Filename Type Size Used Priority
/var/swap file 102396 0 -2
CPU sysfs topology (clusters, cpufreq members, clockspeeds)
cpufreq min max
CPU cluster policy speed speed core type
0 0 0 600 1800 Cortex-A72 / r0p3
1 0 0 600 1800 Cortex-A72 / r0p3
2 0 0 600 1800 Cortex-A72 / r0p3
3 0 0 600 1800 Cortex-A72 / r0p3
Architecture: aarch64
CPU op-mode(s): 32-bit, 64-bit
Byte Order: Little Endian
CPU(s): 4
On-line CPU(s) list: 0-3
Vendor ID: ARM
Model name: Cortex-A72
Model: 3
Thread(s) per core: 1
Core(s) per cluster: 4
Socket(s): -
Cluster(s): 1
Stepping: r0p3
CPU(s) scaling MHz: 100%
CPU max MHz: 1800.0000
CPU min MHz: 600.0000
BogoMIPS: 108.00
Flags: fp asimd evtstrm crc32 cpuid
L1d cache: 128 KiB (4 instances)
L1i cache: 192 KiB (4 instances)
L2 cache: 1 MiB (1 instance)
Vulnerability Gather data sampling: Not affected
Vulnerability Itlb multihit: Not affected
Vulnerability L1tf: Not affected
Vulnerability Mds: Not affected
Vulnerability Meltdown: Not affected
Vulnerability Mmio stale data: Not affected
Vulnerability Retbleed: Not affected
Vulnerability Spec rstack overflow: Not affected
Vulnerability Spec store bypass: Vulnerable
Vulnerability Spectre v1: Mitigation; __user pointer sanitization
Vulnerability Spectre v2: Vulnerable
Vulnerability Srbds: Not affected
Vulnerability Tsx async abort: Not affected
SoC guess: BCM2711C0 or later
DT compat: raspberrypi,4-model-b
brcm,bcm2711
Compiler: /usr/bin/gcc (Debian 12.2.0-14) 12.2.0 / aarch64-linux-gnu
Userland: arm64
ThreadX: 30f0c5e4d076da3ab4f341d88e7d505760b93ad7 / Oct 17 2023 15:39:30
alloc failures: 0
compactions: 0
legacy block fails: 0
Kernel: 6.1.0-rpi8-rpi-v8/aarch64
CONFIG_HZ=250
CONFIG_HZ_250=y
CONFIG_PREEMPTION=y
CONFIG_PREEMPT=y
CONFIG_PREEMPT_BUILD=y
CONFIG_PREEMPT_COUNT=y
CONFIG_PREEMPT_NOTIFIERS=y
CONFIG_PREEMPT_RCU=y
##########################################################################
opp-table-threadx-0:
600 MHz 880.0 mV
700 MHz 880.0 mV
800 MHz 880.0 mV
900 MHz 880.0 mV
1000 MHz 880.0 mV
1100 MHz 880.0 mV
1200 MHz 880.0 mV
1300 MHz 880.0 mV
1400 MHz 880.0 mV
1500 MHz 880.0 mV
1600 MHz 910.0 mV
1700 MHz 930.0 mV
1800 MHz 950.0 mV
##########################################################################
Results validation:
* Measured clockspeed not lower than advertised max CPU clockspeed
* No swapping
* Background activity (%system) OK
* No throttling
Status of performance related policies found below /sys:
* /sys/module/pcie_aspm/parameters/policy: default performance [powersave] powersupersave
| RPi 4 Model B Rev 1.5 / BCM2711 Rev C0 or later | 1800 MHz | 6.1 | Debian GNU/Linux 12 (bookworm) arm64 | 5770 | 1763 | 36230 | 2470 | 3050 | - |
```
Full Result
```
sbc-bench v0.9.42 RPi 4 Model B Rev 1.5 / BCM2711 Rev C0 or later (Sat, 08 Jul 2023 14:41:02 +0200)
Distributor ID: Debian
Description: Debian GNU/Linux 11 (bullseye)
Release: 11
Codename: bullseye
Build system: http://archive.raspberrypi.org/debian/ bullseye main
Raspberry Pi ThreadX version:
Mar 17 2023 10:50:56
Copyright (c) 2012 Broadcom
version 82f3750a65fadae9a38077e3c2e217ad158c8d54 (clean) (release) (start_cd)
ThreadX configuration (/boot/config.txt):
disable_splash=1
hdmi_blanking=2
dtparam=i2c_arm=on
dtparam=spi=on
dtparam=audio=off
dtoverlay=disable-bt
display_auto_detect=1
dtoverlay=vc4-kms-v3d
max_framebuffers=2
arm_64bit=1
disable_overscan=1
[cm4]
otg_mode=1
[pi4]
arm_boost=1
gpu_mem=16
[all]
gpu_mem=16
start_x=1
[pi3]
gpu_mem=16
[pi0]
gpu_mem=16
Actual ThreadX settings:
arm_64bit=1
arm_boost=1
arm_freq=1800
audio_pwm_mode=514
camera_auto_detect=-1
config_hdmi_boost=5
core_freq=500
core_freq_min=200
disable_commandline_tags=2
disable_l2cache=1
disable_overscan=1
disable_splash=1
display_auto_detect=1
display_default_lcd=1
display_hdmi_rotate=-1
display_lcd_rotate=-1
dvfs=3
enable_gic=1
enable_uart=1
force_eeprom_read=1
force_pwm_open=1
framebuffer_depth=16
framebuffer_ignore_alpha=1
framebuffer_swap=1
gpu_freq=500
gpu_freq_min=250
hdmi_blanking=2
init_uart_clock=0x2dc6c00
lcd_framerate=60
mask_gpu_interrupt0=3072
mask_gpu_interrupt1=29731
max_framebuffers=2
pause_burst_frames=1
program_serial_random=1
total_mem=2048
hdmi_force_cec_address:0=65535
hdmi_force_cec_address:1=65535
hdmi_pixel_freq_limit:0=0x11e1a300
hdmi_pixel_freq_limit:1=0x11e1a300
/usr/bin/gcc (Debian 10.2.1-6) 10.2.1 20210110
Uptime: 14:41:02 up 5 min, 1 user, load average: 0.72, 0.66, 0.33, 45.8°C, 214368480
Linux 6.1.21-v8+ (raspberrypi4) 07/08/23 _aarch64_ (4 CPU)
avg-cpu: %user %nice %system %iowait %steal %idle
4.38 0.05 3.48 5.72 0.00 86.37
Device tps kB_read/s kB_wrtn/s kB_dscd/s kB_read kB_wrtn kB_dscd
mmcblk0 56.59 1837.18 1341.78 0.00 632081 461641 0
total used free shared buff/cache available
Mem: 1.9Gi 91Mi 1.6Gi 0.0Ki 140Mi 1.7Gi
Swap: 99Mi 0B 99Mi
Filename Type Size Used Priority
/var/swap file 102396 0 -2
##########################################################################
Checking cpufreq OPP (Cortex-A72):
Cpufreq OPP: 1800 ThreadX: 1800 Measured: 1795 @ 0.9460V
Cpufreq OPP: 1700 ThreadX: 1700 Measured: 1695 @ 0.9240V
Cpufreq OPP: 1600 ThreadX: 1600 Measured: 1595 @ 0.9020V
Cpufreq OPP: 1500 ThreadX: 1500 Measured: 1495 @ 0.8800V
Cpufreq OPP: 1400 ThreadX: 1400 Measured: 1395 @ 0.8800V
Cpufreq OPP: 1300 ThreadX: 1300 Measured: 1295 @ 0.8800V
Cpufreq OPP: 1200 ThreadX: 1200 Measured: 1195 @ 0.8800V
Cpufreq OPP: 1100 ThreadX: 1100 Measured: 1095 @ 0.8800V
Cpufreq OPP: 1000 ThreadX: 1000 Measured: 995 @ 0.8800V
Cpufreq OPP: 900 ThreadX: 900 Measured: 895 @ 0.8800V
Cpufreq OPP: 800 ThreadX: 800 Measured: 795 @ 0.8800V
Cpufreq OPP: 700 ThreadX: 700 Measured: 695 @ 0.8800V
Cpufreq OPP: 600 ThreadX: 600 Measured: 595 @ 0.8800V
##########################################################################
Hardware sensors:
cpu_thermal-virtual-0
temp1: +47.7 C (crit = +110.0 C)
##########################################################################
Executing benchmark on cpu0 (Cortex-A72):
tinymembench v0.4.9-nuumio (simple benchmark for memory throughput and latency)
CFLAGS:
bandwidth test min repeats (-b): 2
bandwidth test max repeats (-B): 3
bandwidth test mem realloc (-M): no (-m for realloc)
latency test repeats (-l): 3
latency test count (-c): 1000000
==========================================================================
== Memory bandwidth tests ==
== ==
== Note 1: 1MB = 1000000 bytes ==
== Note 2: Test result is the best of repeated runs. Number of repeats ==
== is shown in brackets ==
== Note 3: Results for 'copy' tests show how many bytes can be ==
== copied per second (adding together read and writen ==
== bytes would have provided twice higher numbers) ==
== Note 4: 2-pass copy means that we are using a small temporary buffer ==
== to first fetch data into it, and only then write it to the ==
== destination (source -> L1 cache, L1 cache -> destination) ==
== Note 5: If sample standard deviation exceeds 0.1%, it is shown in ==
== brackets ==
==========================================================================
C copy backwards : 2494.8 MB/s (3, 13.9%)
C copy backwards (32 byte blocks) : 2500.4 MB/s (3, 0.2%)
C copy backwards (64 byte blocks) : 2497.7 MB/s (3, 0.1%)
C copy : 2466.2 MB/s (2)
C copy prefetched (32 bytes step) : 2463.6 MB/s (3, 2.9%)
C copy prefetched (64 bytes step) : 2462.2 MB/s (2)
C 2-pass copy : 2059.8 MB/s (3, 0.2%)
C 2-pass copy prefetched (32 bytes step) : 2165.2 MB/s (2)
C 2-pass copy prefetched (64 bytes step) : 2154.4 MB/s (2)
C scan 8 : 888.2 MB/s (3, 0.1%)
C scan 16 : 1676.6 MB/s (3, 0.2%)
C scan 32 : 3253.6 MB/s (2)
C scan 64 : 3965.1 MB/s (2)
C fill : 3058.3 MB/s (3, 0.3%)
C fill (shuffle within 16 byte blocks) : 3073.5 MB/s (3, 0.2%)
C fill (shuffle within 32 byte blocks) : 3079.9 MB/s (3, 1.0%)
C fill (shuffle within 64 byte blocks) : 3053.4 MB/s (3, 0.3%)
---
libc memcpy copy : 2473.6 MB/s (3)
libc memchr scan : 3966.3 MB/s (2)
libc memset fill : 3060.3 MB/s (3, 0.4%)
---
NEON LDP/STP copy : 2463.3 MB/s (2)
NEON LDP/STP copy pldl2strm (32 bytes step) : 2445.0 MB/s (3, 2.8%)
NEON LDP/STP copy pldl2strm (64 bytes step) : 2447.9 MB/s (2)
NEON LDP/STP copy pldl1keep (32 bytes step) : 2468.3 MB/s (2)
NEON LDP/STP copy pldl1keep (64 bytes step) : 2468.0 MB/s (3, 0.2%)
NEON LD1/ST1 copy : 2457.0 MB/s (3, 1.7%)
NEON LDP load : 3985.1 MB/s (2)
NEON LDNP load : 3962.6 MB/s (3)
NEON STP fill : 3041.3 MB/s (2)
NEON STNP fill : 2735.8 MB/s (3, 2.9%)
ARM LDP/STP copy : 2463.4 MB/s (2)
ARM LDP load : 3984.9 MB/s (3, 3.8%)
ARM LDNP load : 3957.3 MB/s (2)
ARM STP fill : 3061.2 MB/s (3, 0.5%)
ARM STNP fill : 2668.6 MB/s (3, 1.8%)
==========================================================================
== Framebuffer read tests. ==
== ==
== Many ARM devices use a part of the system memory as the framebuffer, ==
== typically mapped as uncached but with write-combining enabled. ==
== Writes to such framebuffers are quite fast, but reads are much ==
== slower and very sensitive to the alignment and the selection of ==
== CPU instructions which are used for accessing memory. ==
== ==
== Many x86 systems allocate the framebuffer in the GPU memory, ==
== accessible for the CPU via a relatively slow PCI-E bus. Moreover, ==
== PCI-E is asymmetric and handles reads a lot worse than writes. ==
== ==
== If uncached framebuffer reads are reasonably fast (at least 100 MB/s ==
== or preferably >300 MB/s), then using the shadow framebuffer layer ==
== is not necessary in Xorg DDX drivers, resulting in a nice overall ==
== performance improvement. For example, the xf86-video-fbturbo DDX ==
== uses this trick. ==
==========================================================================
NEON LDP/STP copy (from framebuffer) : 813.7 MB/s (3, 0.5%)
NEON LDP/STP 2-pass copy (from framebuffer) : 735.8 MB/s (3, 3.8%)
NEON LD1/ST1 copy (from framebuffer) : 848.4 MB/s (3, 0.2%)
NEON LD1/ST1 2-pass copy (from framebuffer) : 766.3 MB/s (3, 0.4%)
ARM LDP/STP copy (from framebuffer) : 609.6 MB/s (2)
ARM LDP/STP 2-pass copy (from framebuffer) : 579.2 MB/s (3, 0.5%)
==========================================================================
== Memory latency test ==
== ==
== Average time is measured for random memory accesses in the buffers ==
== of different sizes. The larger is the buffer, the more significant ==
== are relative contributions of TLB, L1/L2 cache misses and SDRAM ==
== accesses. For extremely large buffer sizes we are expecting to see ==
== page table walk with several requests to SDRAM for almost every ==
== memory access (though 64MiB is not nearly large enough to experience ==
== this effect to its fullest). ==
== ==
== Note 1: All the numbers are representing extra time, which needs to ==
== be added to L1 cache latency. The cycle timings for L1 cache ==
== latency can be usually found in the processor documentation. ==
== Note 2: Dual random read means that we are simultaneously performing ==
== two independent memory accesses at a time. In the case if ==
== the memory subsystem can't handle multiple outstanding ==
== requests, dual random read has the same timings as two ==
== single reads performed one after another. ==
==========================================================================
block size : single random read / dual random read
1024 : 0.0 ns / 0.0 ns
2048 : 0.0 ns / 0.0 ns
4096 : 0.0 ns / 0.0 ns
8192 : 0.0 ns / 0.0 ns
16384 : 0.0 ns / 0.0 ns
32768 : 0.0 ns / 0.0 ns
65536 : 4.8 ns / 7.5 ns
131072 : 7.3 ns / 9.9 ns
262144 : 10.5 ns / 13.2 ns
524288 : 12.6 ns / 15.6 ns
1048576 : 26.5 ns / 40.2 ns
2097152 : 82.0 ns / 118.8 ns
4194304 : 110.0 ns / 142.4 ns
8388608 : 130.5 ns / 162.3 ns
16777216 : 141.2 ns / 171.1 ns
33554432 : 146.3 ns / 176.3 ns
67108864 : 157.4 ns / 192.9 ns
##########################################################################
Executing ramlat on cpu0 (Cortex-A72), results in ns:
size: 1x32 2x32 1x64 2x64 1xPTR 2xPTR 4xPTR 8xPTR
4k: 2.825 2.798 2.788 2.790 2.231 2.228 2.228 4.457
8k: 2.785 2.785 2.785 2.785 2.228 2.229 2.267 4.456
16k: 2.789 2.789 2.786 2.785 2.233 2.239 3.022 4.458
32k: 3.977 3.996 3.996 3.994 3.422 3.504 3.803 9.605
64k: 11.40 11.44 11.32 11.49 10.80 11.29 17.93 35.22
128k: 12.27 12.26 12.26 12.26 11.70 12.20 20.82 40.32
256k: 16.68 16.54 16.57 16.57 16.03 15.97 20.84 40.19
512k: 18.27 17.54 17.99 17.51 17.57 19.61 21.12 40.55
1024k: 74.63 55.35 68.58 66.45 74.54 58.47 66.36 92.50
2048k: 116.2 109.2 125.8 109.5 116.2 113.2 124.8 161.2
4096k: 129.7 129.6 133.5 132.6 133.7 135.7 138.9 186.3
8192k: 150.5 153.0 153.0 153.6 152.9 149.3 153.9 206.9
16384k: 152.3 153.8 153.6 153.8 153.7 155.1 159.7 197.4
32768k: 154.3 156.7 153.5 154.5 153.3 157.9 162.1 199.4
65536k: 167.6 172.0 168.5 167.6 167.4 170.5 180.2 206.7
131072k: 167.8 177.8 167.6 168.3 166.5 172.6 181.3 208.1
##########################################################################
Executing benchmark twice on cluster 0 (Cortex-A72)
OpenSSL 1.1.1n, built on 15 Mar 2022
type 16 bytes 64 bytes 256 bytes 1024 bytes 8192 bytes 16384 bytes
aes-128-cbc 45255.64k 48791.49k 50088.62k 50442.92k 50547.37k 50801.32k
aes-128-cbc 45413.82k 48878.63k 50201.60k 50520.06k 50612.91k 50828.63k
aes-192-cbc 38521.58k 41000.45k 42088.70k 42390.19k 42459.14k 42461.87k
aes-192-cbc 38519.55k 40951.77k 42070.19k 42358.78k 42472.79k 42314.41k
aes-256-cbc 33434.53k 35279.66k 36005.72k 36202.50k 36257.79k 36257.79k
aes-256-cbc 33435.35k 35303.62k 36004.27k 36198.40k 36244.14k 36235.95k
##########################################################################
Executing benchmark single-threaded on cpu0 (Cortex-A72)
7-Zip (a) [64] 16.02 : Copyright (c) 1999-2016 Igor Pavlov : 2016-05-21
p7zip Version 16.02 (locale=C,Utf16=off,HugeFiles=on,64 bits,4 CPUs LE)
LE
CPU Freq: 64000000 - - - - - - - -
RAM size: 1899 MB, # CPU hardware threads: 4
RAM usage: 435 MB, # Benchmark threads: 1
Compressing | Decompressing
Dict Speed Usage R/U Rating | Speed Usage R/U Rating
KiB/s % MIPS MIPS | KiB/s % MIPS MIPS
22: 1609 100 1570 1566 | 22619 100 1936 1931
23: 1533 100 1566 1563 | 22285 100 1933 1929
24: 1453 100 1566 1563 | 21890 100 1925 1922
25: 1352 100 1547 1544 | 21393 100 1907 1904
---------------------------------- | ------------------------------
Avr: 100 1562 1559 | 100 1925 1922
Tot: 100 1744 1740
##########################################################################
Executing benchmark 3 times multi-threaded on CPUs 0-3
7-Zip (a) [64] 16.02 : Copyright (c) 1999-2016 Igor Pavlov : 2016-05-21
p7zip Version 16.02 (locale=C,Utf16=off,HugeFiles=on,64 bits,4 CPUs LE)
LE
CPU Freq: - - - - - - - - -
RAM size: 1899 MB, # CPU hardware threads: 4
RAM usage: 882 MB, # Benchmark threads: 4
Compressing | Decompressing
Dict Speed Usage R/U Rating | Speed Usage R/U Rating
KiB/s % MIPS MIPS | KiB/s % MIPS MIPS
22: 3969 337 1147 3861 | 86137 393 1871 7349
23: 3869 359 1097 3943 | 84640 393 1864 7324
24: 3803 372 1099 4090 | 82911 393 1853 7278
25: 3632 371 1117 4147 | 81335 395 1833 7239
---------------------------------- | ------------------------------
Avr: 360 1115 4010 | 393 1855 7297
Tot: 377 1485 5654
7-Zip (a) [64] 16.02 : Copyright (c) 1999-2016 Igor Pavlov : 2016-05-21
p7zip Version 16.02 (locale=C,Utf16=off,HugeFiles=on,64 bits,4 CPUs LE)
LE
CPU Freq: - - - - - - - - -
RAM size: 1899 MB, # CPU hardware threads: 4
RAM usage: 882 MB, # Benchmark threads: 4
Compressing | Decompressing
Dict Speed Usage R/U Rating | Speed Usage R/U Rating
KiB/s % MIPS MIPS | KiB/s % MIPS MIPS
22: 4001 334 1164 3893 | 87552 397 1881 7470
23: 3857 359 1095 3930 | 86029 398 1872 7444
24: 2765 231 1289 2973 | 84249 397 1863 7396
25: 3632 371 1117 4148 | 82292 398 1842 7324
---------------------------------- | ------------------------------
Avr: 324 1166 3736 | 397 1864 7408
Tot: 361 1515 5572
7-Zip (a) [64] 16.02 : Copyright (c) 1999-2016 Igor Pavlov : 2016-05-21
p7zip Version 16.02 (locale=C,Utf16=off,HugeFiles=on,64 bits,4 CPUs LE)
LE
CPU Freq: - 64000000 - - - - - - -
RAM size: 1899 MB, # CPU hardware threads: 4
RAM usage: 882 MB, # Benchmark threads: 4
Compressing | Decompressing
Dict Speed Usage R/U Rating | Speed Usage R/U Rating
KiB/s % MIPS MIPS | KiB/s % MIPS MIPS
22: 4095 346 1151 3984 | 87889 398 1884 7498
23: 3884 362 1093 3958 | 86394 399 1876 7475
24: 3814 373 1098 4101 | 84530 398 1865 7421
25: 3618 372 1112 4131 | 82294 398 1842 7324
---------------------------------- | ------------------------------
Avr: 363 1113 4043 | 398 1867 7430
Tot: 381 1490 5736
Compression: 4010,3736,4043
Decompression: 7297,7408,7430
Total: 5654,5572,5736
##########################################################################
Testing maximum cpufreq again, still under full load. System health now:
Time fake/real load %cpu %sys %usr %nice %io %irq Temp VCore
14:51:00: 1800/1800MHz 4.35 97% 2% 94% 0% 0% 0% 76.0°C 0.9460V
Checking cpufreq OPP (Cortex-A72):
Cpufreq OPP: 1800 ThreadX: 1800 Measured: 1795 @ 0.9460V
##########################################################################
Hardware sensors:
cpu_thermal-virtual-0
temp1: +70.6 C (crit = +110.0 C)
##########################################################################
Thermal source: /sys/devices/virtual/thermal/thermal_zone0/ (cpu-thermal)
System health while running tinymembench:
Time fake/real load %cpu %sys %usr %nice %io %irq Temp VCore
14:42:04: 1800/1800MHz 1.01 15% 3% 7% 0% 4% 0% 48.7°C 0.9460V
14:42:14: 1800/1800MHz 1.01 25% 0% 25% 0% 0% 0% 49.7°C 0.9460V
14:42:24: 1800/1800MHz 1.15 25% 0% 25% 0% 0% 0% 51.1°C 0.9460V
14:42:34: 1800/1800MHz 1.20 25% 0% 25% 0% 0% 0% 51.6°C 0.9460V
14:42:44: 1800/1800MHz 1.17 25% 0% 25% 0% 0% 0% 51.6°C 0.9460V
14:42:54: 1800/1800MHz 1.14 25% 0% 25% 0% 0% 0% 51.6°C 0.9460V
14:43:04: 1800/1800MHz 1.12 25% 0% 25% 0% 0% 0% 52.1°C 0.9460V
14:43:15: 1800/1800MHz 1.10 25% 0% 25% 0% 0% 0% 52.6°C 0.9460V
14:43:25: 1800/1800MHz 1.16 25% 0% 24% 0% 0% 0% 51.6°C 0.9460V
System health while running ramlat:
Time fake/real load %cpu %sys %usr %nice %io %irq Temp VCore
14:43:31: 1800/1800MHz 1.23 17% 2% 10% 0% 4% 0% 52.6°C 0.9460V
14:43:34: 1800/1800MHz 1.23 25% 0% 25% 0% 0% 0% 52.1°C 0.9460V
14:43:37: 1800/1800MHz 1.21 25% 0% 24% 0% 0% 0% 52.1°C 0.9460V
14:43:40: 1800/1800MHz 1.19 25% 0% 24% 0% 0% 0% 52.6°C 0.9460V
14:43:43: 1800/1800MHz 1.19 25% 0% 25% 0% 0% 0% 52.6°C 0.9460V
14:43:46: 1800/1800MHz 1.17 25% 0% 25% 0% 0% 0% 52.6°C 0.9460V
14:43:49: 1800/1800MHz 1.16 25% 0% 25% 0% 0% 0% 52.1°C 0.9460V
14:43:52: 1800/1800MHz 1.16 25% 0% 24% 0% 0% 0% 51.6°C 0.9460V
14:43:55: 1800/1800MHz 1.15 25% 0% 24% 0% 0% 0% 53.1°C 0.9460V
14:43:58: 1800/1800MHz 1.15 25% 1% 24% 0% 0% 0% 51.6°C 0.9460V
14:44:01: 1800/1800MHz 1.22 25% 1% 24% 0% 0% 0% 52.1°C 0.9460V
System health while running OpenSSL benchmark:
Time fake/real load %cpu %sys %usr %nice %io %irq Temp VCore
14:44:04: 1800/1800MHz 1.36 17% 2% 11% 0% 3% 0% 53.6°C 0.9460V
14:44:20: 1800/1800MHz 1.28 25% 0% 24% 0% 0% 0% 53.6°C 0.9460V
14:44:36: 1800/1800MHz 1.22 25% 0% 25% 0% 0% 0% 54.5°C 0.9460V
14:44:52: 1800/1800MHz 1.17 25% 0% 25% 0% 0% 0% 53.6°C 0.9460V
14:45:08: 1800/1800MHz 1.13 25% 0% 25% 0% 0% 0% 56.0°C 0.9460V
14:45:24: 1800/1800MHz 1.17 25% 0% 25% 0% 0% 0% 54.5°C 0.9460V
14:45:40: 1800/1800MHz 1.13 25% 0% 25% 0% 0% 0% 54.0°C 0.9460V
System health while running 7-zip single core benchmark:
Time fake/real load %cpu %sys %usr %nice %io %irq Temp VCore
14:45:52: 1800/1800MHz 1.11 19% 2% 13% 0% 3% 0% 56.5°C 0.9460V
14:45:59: 1800/1800MHz 1.09 25% 0% 24% 0% 0% 0% 55.0°C 0.9460V
14:46:06: 1800/1800MHz 1.08 25% 0% 24% 0% 0% 0% 54.5°C 0.9460V
14:46:14: 1800/1800MHz 1.08 25% 0% 24% 0% 0% 0% 55.5°C 0.9460V
14:46:21: 1800/1800MHz 1.06 25% 0% 24% 0% 0% 0% 55.5°C 0.9460V
14:46:28: 1800/1800MHz 1.06 25% 0% 24% 0% 0% 0% 56.0°C 0.9460V
14:46:35: 1800/1800MHz 1.05 25% 0% 24% 0% 0% 0% 55.5°C 0.9460V
14:46:42: 1800/1800MHz 1.05 25% 0% 24% 0% 0% 0% 56.0°C 0.9460V
14:46:49: 1800/1800MHz 1.12 25% 1% 24% 0% 0% 0% 56.5°C 0.9460V
14:46:56: 1800/1800MHz 1.10 25% 0% 24% 0% 0% 0% 56.0°C 0.9460V
14:47:03: 1800/1800MHz 1.09 25% 0% 24% 0% 0% 0% 56.0°C 0.9460V
14:47:10: 1800/1800MHz 1.08 25% 0% 24% 0% 0% 0% 57.5°C 0.9460V
System health while running 7-zip multi core benchmark:
Time fake/real load %cpu %sys %usr %nice %io %irq Temp VCore
14:47:17: 1800/1800MHz 1.07 20% 1% 15% 0% 2% 0% 58.9°C 0.9460V
14:47:32: 1800/1800MHz 1.65 92% 1% 91% 0% 0% 0% 63.8°C 0.9460V
14:47:47: 1800/1800MHz 2.17 93% 1% 91% 0% 0% 0% 65.2°C 0.9460V
14:48:02: 1800/1800MHz 2.72 97% 1% 95% 0% 0% 0% 67.2°C 0.9460V
14:48:19: 1800/1800MHz 3.01 89% 3% 86% 0% 0% 0% 68.2°C 0.9460V
14:48:34: 1800/1800MHz 3.37 93% 2% 91% 0% 0% 0% 70.1°C 0.9460V
14:48:49: 1800/1800MHz 3.70 94% 1% 92% 0% 0% 0% 69.1°C 0.9460V
14:49:04: 1800/1800MHz 3.62 78% 1% 77% 0% 0% 0% 69.1°C 0.9460V
14:49:20: 1800/1800MHz 3.70 86% 1% 85% 0% 0% 0% 73.0°C 0.9460V
14:49:36: 1800/1800MHz 3.85 89% 3% 85% 0% 0% 0% 71.6°C 0.9460V
14:49:51: 1800/1800MHz 4.04 94% 2% 92% 0% 0% 0% 72.1°C 0.9460V
14:50:06: 1800/1800MHz 4.27 95% 1% 93% 0% 0% 0% 74.0°C 0.9460V
14:50:25: 1800/1800MHz 4.20 94% 2% 92% 0% 0% 0% 75.0°C 0.9460V
14:50:40: 1800/1800MHz 4.36 91% 2% 89% 0% 0% 0% 74.5°C 0.9460V
14:51:00: 1800/1800MHz 4.35 97% 2% 94% 0% 0% 0% 76.0°C 0.9460V
##########################################################################
Linux 6.1.21-v8+ (raspberrypi4) 07/08/23 _aarch64_ (4 CPU)
avg-cpu: %user %nice %system %iowait %steal %idle
32.95 0.05 2.01 2.14 0.00 62.85
Device tps kB_read/s kB_wrtn/s kB_dscd/s kB_read kB_wrtn kB_dscd
mmcblk0 21.67 677.98 547.37 0.00 641929 518265 0
total used free shared buff/cache available
Mem: 1.9Gi 93Mi 1.7Gi 0.0Ki 85Mi 1.7Gi
Swap: 99Mi 0B 99Mi
Filename Type Size Used Priority
/var/swap file 102396 0 -2
CPU sysfs topology (clusters, cpufreq members, clockspeeds)
cpufreq min max
CPU cluster policy speed speed core type
0 0 0 600 1800 Cortex-A72 / r0p3
1 0 0 600 1800 Cortex-A72 / r0p3
2 0 0 600 1800 Cortex-A72 / r0p3
3 0 0 600 1800 Cortex-A72 / r0p3
Architecture: aarch64
CPU op-mode(s): 32-bit, 64-bit
Byte Order: Little Endian
CPU(s): 4
On-line CPU(s) list: 0-3
Thread(s) per core: 1
Core(s) per socket: 4
Socket(s): 1
Vendor ID: ARM
Model: 3
Model name: Cortex-A72
Stepping: r0p3
CPU max MHz: 1800.0000
CPU min MHz: 600.0000
BogoMIPS: 108.00
L1d cache: 128 KiB
L1i cache: 192 KiB
L2 cache: 1 MiB
Vulnerability Itlb multihit: Not affected
Vulnerability L1tf: Not affected
Vulnerability Mds: Not affected
Vulnerability Meltdown: Not affected
Vulnerability Mmio stale data: Not affected
Vulnerability Retbleed: Not affected
Vulnerability Spec store bypass: Vulnerable
Vulnerability Spectre v1: Mitigation; __user pointer sanitization
Vulnerability Spectre v2: Vulnerable
Vulnerability Srbds: Not affected
Vulnerability Tsx async abort: Not affected
Flags: fp asimd evtstrm crc32 cpuid
SoC guess: BCM2711C0 or later
DT compat: raspberrypi,4-model-b
brcm,bcm2711
Compiler: /usr/bin/gcc (Debian 10.2.1-6) 10.2.1 20210110 / aarch64-linux-gnu
Userland: arm64
ThreadX: 82f3750a65fadae9a38077e3c2e217ad158c8d54 / Mar 17 2023 10:50:56
alloc failures: 0
compactions: 0
legacy block fails: 0
Kernel: 6.1.21-v8+/aarch64
CONFIG_HZ=250
CONFIG_HZ_250=y
CONFIG_PREEMPTION=y
CONFIG_PREEMPTIRQ_TRACEPOINTS=y
CONFIG_PREEMPT=y
CONFIG_PREEMPT_BUILD=y
CONFIG_PREEMPT_COUNT=y
CONFIG_PREEMPT_NOTIFIERS=y
CONFIG_PREEMPT_RCU=y
##########################################################################
Kernel 6.1.21 is not latest 6.1.38 LTS that was released on 2023-07-05.
See https://endoflife.date/linux for details. Perhaps some kernel bugs have
been fixed in the meantime and maybe vulnerabilities as well.
##########################################################################
Results validation:
* Measured clockspeed not lower than advertised max CPU clockspeed
* No swapping
* Background activity (%system) OK
* No throttling
| RPi 4 Model B Rev 1.5 / BCM2711 Rev C0 or later | 1800 MHz | 6.1 | Debian GNU/Linux 11 (bullseye) arm64 | 5650 | 1740 | 36250 | 2470 | 3060 | - |
```
Virtual Machine on VMware ESXi 7.0 Release 1.13, Dual-Core Virtual Machine. Host @2100 MHz
Linux raspberrypi4 6.3.0-1-arm64 #1 SMP Debian 6.3.7-1 (2023-06-12) aarch64 GNU/Linux
```
08.07.2023
sbc-bench v0.9.42
Installing needed tools: Done.
Checking cpufreq OPP. Done (results will be available in 9-14 minutes).
Executing tinymembench. Done.
Executing RAM latency tester. Done.
Executing OpenSSL benchmark. Done.
Executing 7-zip benchmark... Done.
Checking cpufreq OPP again. Done (9 minutes elapsed).
Results validation:
* No swapping
* Throttling occured
Memory performance
memcpy: 2421.0 MB/s
memset: 3243.7 MB/s
7-zip total scores (3 consecutive runs): 3341,3410,3393, single-threaded: 1798
OpenSSL results:
type 16 bytes 64 bytes 256 bytes 1024 bytes 8192 bytes 16384 bytes
aes-128-cbc 49447.93k 53976.09k 55393.79k 55831.21k 55986.86k 55907.67k
aes-128-cbc 49542.43k 53921.32k 55418.20k 55851.69k 55965.01k 56027.82k
aes-192-cbc 42226.14k 45174.42k 46304.00k 46683.14k 46631.59k 46830.93k
aes-192-cbc 41792.09k 44896.04k 46208.77k 46623.74k 46918.31k 46749.01k
aes-256-cbc 36586.13k 38903.94k 39674.79k 40048.98k 40012.46k 40080.73k
aes-256-cbc 36114.35k 39022.19k 39820.71k 39884.12k 40108.03k 39927.81k
```
Full Result
```
sbc-bench v0.9.42 VMware Cortex-A72 VM (Sat, 08 Jul 2023 15:08:50 +0200)
Distributor ID: Debian
Description: Debian GNU/Linux trixie/sid
Codename: trixie
Device Info:
Manufacturer: VMware, Inc.
Product Name: VMware20,1
Version: 1
SKU Number: 0000000000000001
Family: VMware
BIOS/UEFI:
Vendor: VMware, Inc.
Version: VMW201.00V.21747440.BA64.2305102224
Release Date: 05/10/2023
/usr/bin/gcc (Debian 12.3.0-4) 12.3.0
Uptime: 15:08:50 up 7 min, 2 users, load average: 0.08, 0.04, 0.01, °C, 182776534
Linux 6.3.0-1-arm64 (raspberrypi4) 07/08/23 _aarch64_ (2 CPU)
avg-cpu: %user %nice %system %iowait %steal %idle
0.66 0.00 1.29 0.46 0.00 97.60
Device tps kB_read/s kB_wrtn/s kB_dscd/s kB_read kB_wrtn kB_dscd
sda 15.09 656.11 27.82 0.00 294193 12476 0
total used free shared buff/cache available
Mem: 974Mi 189Mi 754Mi 572Ki 98Mi 784Mi
Swap: 951Mi 0B 951Mi
Filename Type Size Used Priority
/dev/sda3 partition 974844 0 -2
##########################################################################
Checking cpufreq OPP (Cortex-A72):
No cpufreq support available. Measured on cpu1: 1990 MHz (1990.790/1990.163/1989.586)
##########################################################################
Executing benchmark on cpu0 (Cortex-A72):
tinymembench v0.4.9-nuumio (simple benchmark for memory throughput and latency)
CFLAGS:
bandwidth test min repeats (-b): 2
bandwidth test max repeats (-B): 3
bandwidth test mem realloc (-M): no (-m for realloc)
latency test repeats (-l): 3
latency test count (-c): 1000000
==========================================================================
== Memory bandwidth tests ==
== ==
== Note 1: 1MB = 1000000 bytes ==
== Note 2: Test result is the best of repeated runs. Number of repeats ==
== is shown in brackets ==
== Note 3: Results for 'copy' tests show how many bytes can be ==
== copied per second (adding together read and writen ==
== bytes would have provided twice higher numbers) ==
== Note 4: 2-pass copy means that we are using a small temporary buffer ==
== to first fetch data into it, and only then write it to the ==
== destination (source -> L1 cache, L1 cache -> destination) ==
== Note 5: If sample standard deviation exceeds 0.1%, it is shown in ==
== brackets ==
==========================================================================
C copy backwards : 2146.2 MB/s (3, 7.9%)
C copy backwards (32 byte blocks) : 2417.3 MB/s (3, 0.7%)
C copy backwards (64 byte blocks) : 2429.6 MB/s (3, 0.8%)
C copy : 2430.3 MB/s (3, 0.3%)
C copy prefetched (32 bytes step) : 2416.9 MB/s (3, 1.6%)
C copy prefetched (64 bytes step) : 2420.6 MB/s (2)
C 2-pass copy : 1559.1 MB/s (3, 0.3%)
C 2-pass copy prefetched (32 bytes step) : 1733.8 MB/s (3, 2.7%)
C 2-pass copy prefetched (64 bytes step) : 1750.9 MB/s (3, 1.1%)
C scan 8 : 976.3 MB/s (3, 0.3%)
C scan 16 : 1936.6 MB/s (3, 0.7%)
C scan 32 : 3675.3 MB/s (3, 1.1%)
C scan 64 : 4006.4 MB/s (3, 0.6%)
C fill : 3276.2 MB/s (3, 0.6%)
C fill (shuffle within 16 byte blocks) : 3272.8 MB/s (2)
C fill (shuffle within 32 byte blocks) : 3267.8 MB/s (3, 0.8%)
C fill (shuffle within 64 byte blocks) : 3269.3 MB/s (3, 0.4%)
---
libc memcpy copy : 2421.0 MB/s (3, 0.4%)
libc memchr scan : 4017.9 MB/s (3, 1.2%)
libc memset fill : 3243.7 MB/s (3, 0.4%)
---
NEON LDP/STP copy : 2426.9 MB/s (3, 1.7%)
NEON LDP/STP copy pldl2strm (32 bytes step) : 2402.2 MB/s (3, 0.5%)
NEON LDP/STP copy pldl2strm (64 bytes step) : 2396.6 MB/s (3, 1.6%)
NEON LDP/STP copy pldl1keep (32 bytes step) : 2413.2 MB/s (3, 1.9%)
NEON LDP/STP copy pldl1keep (64 bytes step) : 1757.2 MB/s (3, 5.9%)
NEON LD1/ST1 copy : 2426.1 MB/s (3, 1.0%)
NEON LDP load : 4020.3 MB/s (2)
NEON LDNP load : 3973.5 MB/s (3, 21.6%)
NEON STP fill : 3220.0 MB/s (3, 8.5%)
NEON STNP fill : 3063.7 MB/s (3, 3.9%)
ARM LDP/STP copy : 2343.3 MB/s (3, 19.4%)
ARM LDP load : 4006.4 MB/s (3, 3.5%)
ARM LDNP load : 4002.0 MB/s (2)
ARM STP fill : 3274.8 MB/s (3, 0.2%)
ARM STNP fill : 3066.6 MB/s (3, 2.9%)
==========================================================================
== Framebuffer read tests. ==
== ==
== Many ARM devices use a part of the system memory as the framebuffer, ==
== typically mapped as uncached but with write-combining enabled. ==
== Writes to such framebuffers are quite fast, but reads are much ==
== slower and very sensitive to the alignment and the selection of ==
== CPU instructions which are used for accessing memory. ==
== ==
== Many x86 systems allocate the framebuffer in the GPU memory, ==
== accessible for the CPU via a relatively slow PCI-E bus. Moreover, ==
== PCI-E is asymmetric and handles reads a lot worse than writes. ==
== ==
== If uncached framebuffer reads are reasonably fast (at least 100 MB/s ==
== or preferably >300 MB/s), then using the shadow framebuffer layer ==
== is not necessary in Xorg DDX drivers, resulting in a nice overall ==
== performance improvement. For example, the xf86-video-fbturbo DDX ==
== uses this trick. ==
==========================================================================
NEON LDP/STP copy (from framebuffer) : 2541.3 MB/s (3, 15.9%)
NEON LDP/STP 2-pass copy (from framebuffer) : 1826.7 MB/s (3, 1.4%)
NEON LD1/ST1 copy (from framebuffer) : 2515.2 MB/s (3, 3.5%)
NEON LD1/ST1 2-pass copy (from framebuffer) : 1847.8 MB/s (3, 2.8%)
ARM LDP/STP copy (from framebuffer) : 2516.5 MB/s (3, 2.0%)
ARM LDP/STP 2-pass copy (from framebuffer) : 1838.1 MB/s (3, 1.1%)
==========================================================================
== Memory latency test ==
== ==
== Average time is measured for random memory accesses in the buffers ==
== of different sizes. The larger is the buffer, the more significant ==
== are relative contributions of TLB, L1/L2 cache misses and SDRAM ==
== accesses. For extremely large buffer sizes we are expecting to see ==
== page table walk with several requests to SDRAM for almost every ==
== memory access (though 64MiB is not nearly large enough to experience ==
== this effect to its fullest). ==
== ==
== Note 1: All the numbers are representing extra time, which needs to ==
== be added to L1 cache latency. The cycle timings for L1 cache ==
== latency can be usually found in the processor documentation. ==
== Note 2: Dual random read means that we are simultaneously performing ==
== two independent memory accesses at a time. In the case if ==
== the memory subsystem can't handle multiple outstanding ==
== requests, dual random read has the same timings as two ==
== single reads performed one after another. ==
==========================================================================
block size : single random read / dual random read, [MADV_NOHUGEPAGE]
1024 : 0.0 ns / 0.0 ns
2048 : 0.0 ns / 0.0 ns
4096 : 0.0 ns / 0.0 ns
8192 : 0.0 ns / 0.0 ns
16384 : 0.0 ns / 0.0 ns
32768 : 0.1 ns / 0.0 ns
65536 : 4.4 ns / 6.7 ns
131072 : 6.6 ns / 8.9 ns
262144 : 9.6 ns / 11.9 ns
524288 : 12.2 ns / 14.2 ns
1048576 : 32.1 ns / 49.8 ns
2097152 : 83.8 ns / 120.9 ns
4194304 : 113.3 ns / 145.0 ns
8388608 : 148.5 ns / 185.8 ns
16777216 : 165.1 ns / 212.5 ns
33554432 : 177.4 ns / 229.7 ns
67108864 : 222.1 ns / 313.2 ns
block size : single random read / dual random read, [MADV_HUGEPAGE]
1024 : 0.0 ns / 0.0 ns
2048 : 0.0 ns / 0.0 ns
4096 : 0.0 ns / 0.0 ns
8192 : 0.0 ns / 0.0 ns
16384 : 0.0 ns / 0.0 ns
32768 : 2.2 ns / 3.7 ns
65536 : 4.4 ns / 6.7 ns
131072 : 6.7 ns / 8.9 ns
262144 : 9.6 ns / 11.9 ns
524288 : 11.6 ns / 14.2 ns
1048576 : 30.6 ns / 50.4 ns
2097152 : 84.6 ns / 120.8 ns
4194304 : 111.7 ns / 144.5 ns
8388608 : 146.8 ns / 185.3 ns
16777216 : 164.5 ns / 208.4 ns
33554432 : 173.2 ns / 221.4 ns
67108864 : 179.4 ns / 231.5 ns
##########################################################################
Executing ramlat on cpu0 (Cortex-A72), results in ns:
size: 1x32 2x32 1x64 2x64 1xPTR 2xPTR 4xPTR 8xPTR
4k: 2.573 2.533 2.516 2.514 2.012 2.015 2.025 4.038
8k: 2.515 2.513 2.516 2.514 2.013 2.014 2.051 4.295
16k: 2.535 2.516 2.515 2.538 2.013 2.012 2.711 4.028
32k: 2.520 2.524 2.525 2.519 2.015 2.017 2.995 4.038
64k: 11.03 11.11 11.10 11.21 10.56 10.92 18.16 36.23
128k: 11.09 11.11 11.10 11.14 10.59 11.68 18.37 36.45
256k: 17.15 16.84 16.96 16.84 16.46 16.41 19.69 36.65
512k: 15.66 15.34 15.93 15.39 18.55 15.70 19.50 36.91
1024k: 96.15 74.11 93.91 70.15 82.78 70.09 80.89 104.9
2048k: 125.7 127.5 129.7 124.4 126.5 118.3 132.6 199.8
4096k: 135.8 134.8 135.8 138.6 136.7 135.8 142.7 183.3
8192k: 185.0 187.0 184.0 185.4 185.5 179.4 186.0 203.9
16384k: 183.2 185.5 185.2 185.9 186.1 185.1 192.9 214.3
32768k: 184.8 187.0 184.8 187.1 187.2 189.6 197.9 221.0
65536k: 185.8 188.8 186.6 188.6 189.5 192.3 199.8 224.8
131072k: 187.2 264.9 192.4 196.3 189.5 207.5 207.1 228.6
##########################################################################
Executing benchmark twice on cluster 0 (Cortex-A72)
OpenSSL 3.0.9, built on 30 May 2023 (Library: OpenSSL 3.0.9 30 May 2023)
type 16 bytes 64 bytes 256 bytes 1024 bytes 8192 bytes 16384 bytes
aes-128-cbc 49447.93k 53976.09k 55393.79k 55831.21k 55986.86k 55907.67k
aes-128-cbc 49542.43k 53921.32k 55418.20k 55851.69k 55965.01k 56027.82k
aes-192-cbc 42226.14k 45174.42k 46304.00k 46683.14k 46631.59k 46830.93k
aes-192-cbc 41792.09k 44896.04k 46208.77k 46623.74k 46918.31k 46749.01k
aes-256-cbc 36586.13k 38903.94k 39674.79k 40048.98k 40012.46k 40080.73k
aes-256-cbc 36114.35k 39022.19k 39820.71k 39884.12k 40108.03k 39927.81k
##########################################################################
Executing benchmark single-threaded on cpu0 (Cortex-A72)
7-Zip (a) [64] 16.02 : Copyright (c) 1999-2016 Igor Pavlov : 2016-05-21
p7zip Version 16.02 (locale=C,Utf16=off,HugeFiles=on,64 bits,2 CPUs LE)
LE
CPU Freq: - - 64000000 - - - - - -
RAM size: 974 MB, # CPU hardware threads: 2
RAM usage: 435 MB, # Benchmark threads: 1
Compressing | Decompressing
Dict Speed Usage R/U Rating | Speed Usage R/U Rating
KiB/s % MIPS MIPS | KiB/s % MIPS MIPS
22: 1560 100 1522 1518 | 24697 100 2112 2109
23: 1500 100 1531 1529 | 24158 100 2094 2091
24: 1414 100 1524 1520 | 23606 100 2076 2072
25: 1309 100 1497 1495 | 23030 100 2052 2050
---------------------------------- | ------------------------------
Avr: 100 1518 1516 | 100 2083 2081
Tot: 100 1801 1798
##########################################################################
Executing benchmark 3 times multi-threaded on CPUs 0-1
7-Zip (a) [64] 16.02 : Copyright (c) 1999-2016 Igor Pavlov : 2016-05-21
p7zip Version 16.02 (locale=C,Utf16=off,HugeFiles=on,64 bits,2 CPUs LE)
LE
CPU Freq: - - - - - - - - -
RAM size: 974 MB, # CPU hardware threads: 2
RAM usage: 441 MB, # Benchmark threads: 2
Compressing | Decompressing
Dict Speed Usage R/U Rating | Speed Usage R/U Rating
KiB/s % MIPS MIPS | KiB/s % MIPS MIPS
22: 2623 176 1452 2553 | 47959 198 2068 4095
23: 2613 186 1435 2662 | 46837 198 2050 4054
24: 2545 187 1466 2737 | 45543 198 2024 3998
25: 2346 185 1448 2679 | 44415 197 2005 3953
---------------------------------- | ------------------------------
Avr: 183 1450 2658 | 198 2037 4025
Tot: 190 1744 3341
7-Zip (a) [64] 16.02 : Copyright (c) 1999-2016 Igor Pavlov : 2016-05-21
p7zip Version 16.02 (locale=C,Utf16=off,HugeFiles=on,64 bits,2 CPUs LE)
LE
CPU Freq: - - - - - - - - -
RAM size: 974 MB, # CPU hardware threads: 2
RAM usage: 441 MB, # Benchmark threads: 2
Compressing | Decompressing
Dict Speed Usage R/U Rating | Speed Usage R/U Rating
KiB/s % MIPS MIPS | KiB/s % MIPS MIPS
22: 2884 186 1508 2806 | 48366 199 2080 4130
23: 2680 188 1451 2731 | 47504 199 2064 4112
24: 2540 187 1460 2732 | 46113 199 2039 4048
25: 2379 184 1473 2716 | 45009 199 2017 4006
---------------------------------- | ------------------------------
Avr: 186 1473 2746 | 199 2050 4074
Tot: 193 1761 3410
7-Zip (a) [64] 16.02 : Copyright (c) 1999-2016 Igor Pavlov : 2016-05-21
p7zip Version 16.02 (locale=C,Utf16=off,HugeFiles=on,64 bits,2 CPUs LE)
LE
CPU Freq: - - - - - - - - -
RAM size: 974 MB, # CPU hardware threads: 2
RAM usage: 441 MB, # Benchmark threads: 2
Compressing | Decompressing
Dict Speed Usage R/U Rating | Speed Usage R/U Rating
KiB/s % MIPS MIPS | KiB/s % MIPS MIPS
22: 2686 177 1480 2613 | 48604 199 2088 4150
23: 2642 188 1432 2693 | 47805 200 2073 4138
24: 2556 187 1473 2749 | 46454 199 2046 4078
25: 2363 185 1461 2699 | 45247 199 2024 4027
---------------------------------- | ------------------------------
Avr: 184 1461 2688 | 199 2058 4098
Tot: 192 1760 3393
Compression: 2658,2746,2688
Decompression: 4025,4074,4098
Total: 3341,3410,3393
##########################################################################
Testing maximum cpufreq again, still under full load. System health now:
Time CPU n/a load %cpu %sys %usr %nice %io %irq Temp
15:17:20: n/a MHz 1.95 95% 2% 93% 0% 0% 0% °C
Checking cpufreq OPP (Cortex-A72):
No cpufreq support available. Measured on cpu1: 1992 MHz (1992.379/1992.304/1992.204)
##########################################################################
System health while running tinymembench:
Time CPU n/a load %cpu %sys %usr %nice %io %irq Temp
15:08:56: n/a MHz 0.15 3% 1% 1% 0% 0% 0% °C
15:09:06: n/a MHz 0.28 51% 0% 50% 0% 0% 0% °C
15:09:16: n/a MHz 0.39 50% 0% 50% 0% 0% 0% °C
15:09:26: n/a MHz 0.56 50% 0% 50% 0% 0% 0% °C
15:09:37: n/a MHz 0.63 50% 0% 50% 0% 0% 0% °C
15:09:47: n/a MHz 0.69 51% 0% 50% 0% 0% 0% °C
15:09:57: n/a MHz 0.74 51% 0% 50% 0% 0% 0% °C
15:10:07: n/a MHz 0.78 50% 0% 50% 0% 0% 0% °C
15:10:17: n/a MHz 0.81 50% 0% 50% 0% 0% 0% °C
15:10:27: n/a MHz 0.84 50% 0% 49% 0% 0% 0% °C
System health while running ramlat:
Time CPU n/a load %cpu %sys %usr %nice %io %irq Temp
15:10:37: n/a MHz 0.87 11% 1% 10% 0% 0% 0% °C
15:10:40: n/a MHz 0.88 50% 0% 50% 0% 0% 0% °C
15:10:43: n/a MHz 0.89 50% 0% 50% 0% 0% 0% °C
15:10:46: n/a MHz 0.89 50% 0% 50% 0% 0% 0% °C
15:10:49: n/a MHz 0.90 50% 0% 50% 0% 0% 0% °C
15:10:52: n/a MHz 0.90 50% 0% 50% 0% 0% 0% °C
15:10:55: n/a MHz 0.90 50% 0% 50% 0% 0% 0% °C
15:10:58: n/a MHz 0.91 50% 0% 49% 0% 0% 0% °C
15:11:01: n/a MHz 0.91 50% 0% 50% 0% 0% 0% °C
15:11:04: n/a MHz 0.92 50% 0% 49% 0% 0% 0% °C
15:11:07: n/a MHz 0.93 50% 1% 49% 0% 0% 0% °C
15:11:11: n/a MHz 0.93 51% 1% 48% 0% 0% 0% °C
System health while running OpenSSL benchmark:
Time CPU n/a load %cpu %sys %usr %nice %io %irq Temp
15:11:12: n/a MHz 0.93 14% 1% 12% 0% 0% 0% °C
15:11:28: n/a MHz 0.95 50% 0% 50% 0% 0% 0% °C
15:11:44: n/a MHz 0.96 50% 0% 50% 0% 0% 0% °C
15:12:00: n/a MHz 0.97 50% 0% 50% 0% 0% 0% °C
15:12:16: n/a MHz 0.98 50% 0% 50% 0% 0% 0% °C
15:12:32: n/a MHz 0.98 50% 0% 50% 0% 0% 0% °C
15:12:48: n/a MHz 0.99 50% 0% 50% 0% 0% 0% °C
System health while running 7-zip single core benchmark:
Time CPU n/a load %cpu %sys %usr %nice %io %irq Temp
15:13:00: n/a MHz 0.99 19% 1% 18% 0% 0% 0% °C
15:13:07: n/a MHz 0.99 50% 0% 49% 0% 0% 0% °C
15:13:14: n/a MHz 0.99 50% 0% 50% 0% 0% 0% °C
15:13:21: n/a MHz 0.99 50% 1% 49% 0% 0% 0% °C
15:13:28: n/a MHz 1.00 50% 0% 49% 0% 0% 0% °C
15:13:35: n/a MHz 1.00 50% 1% 49% 0% 0% 0% °C
15:13:42: n/a MHz 1.00 50% 1% 49% 0% 0% 0% °C
15:13:49: n/a MHz 1.00 50% 0% 49% 0% 0% 0% °C
15:13:56: n/a MHz 1.00 50% 1% 48% 0% 0% 0% °C
15:14:03: n/a MHz 1.00 50% 1% 49% 0% 0% 0% °C
15:14:10: n/a MHz 1.00 50% 1% 49% 0% 0% 0% °C
15:14:18: n/a MHz 1.00 50% 0% 49% 0% 0% 0% °C
System health while running 7-zip multi core benchmark:
Time CPU n/a load %cpu %sys %usr %nice %io %irq Temp
15:14:23: n/a MHz 1.16 23% 1% 21% 0% 0% 0% °C
15:14:52: n/a MHz 1.63 96% 1% 94% 0% 0% 0% °C
15:15:21: n/a MHz 1.91 95% 2% 92% 0% 0% 0% °C
15:15:51: n/a MHz 2.01 96% 1% 95% 0% 0% 0% °C
15:16:21: n/a MHz 2.08 95% 2% 93% 0% 0% 0% °C
15:16:50: n/a MHz 1.91 96% 1% 94% 0% 0% 0% °C
15:17:20: n/a MHz 1.95 95% 2% 93% 0% 0% 0% °C
##########################################################################
Linux 6.3.0-1-arm64 (raspberrypi4) 07/08/23 _aarch64_ (2 CPU)
avg-cpu: %user %nice %system %iowait %steal %idle
35.36 0.02 1.27 0.22 0.00 63.12
Device tps kB_read/s kB_wrtn/s kB_dscd/s kB_read kB_wrtn kB_dscd
sda 7.70 312.14 15.57 0.00 301621 15048 0
total used free shared buff/cache available
Mem: 974Mi 202Mi 734Mi 568Ki 106Mi 772Mi
Swap: 951Mi 0B 951Mi
Filename Type Size Used Priority
/dev/sda3 partition 974844 0 -2
CPU sysfs topology (clusters, cpufreq members, clockspeeds)
cpufreq min max
CPU cluster policy speed speed core type
0 36 0 - - Cortex-A72 / r0p3
1 36 0 - - Cortex-A72 / r0p3
Architecture: aarch64
CPU op-mode(s): 32-bit, 64-bit
Byte Order: Little Endian
CPU(s): 2
On-line CPU(s) list: 0,1
Vendor ID: ARM
BIOS Vendor ID: Arm
Model name: Cortex-A72
BIOS Model name: Arm Cortex-A72 r0p3 CPU @ 0.0GHz
BIOS CPU family: 280
Model: 3
Thread(s) per core: 1
Core(s) per socket: 2
Socket(s): 1
Stepping: r0p3
BogoMIPS: 108.00
Flags: fp asimd evtstrm crc32 cpuid
L1d cache: 64 KiB (2 instances)
L1i cache: 96 KiB (2 instances)
L2 cache: 2 MiB (2 instances)
NUMA node(s): 1
NUMA node0 CPU(s): 0,1
Vulnerability Itlb multihit: Not affected
Vulnerability L1tf: Not affected
Vulnerability Mds: Not affected
Vulnerability Meltdown: Not affected
Vulnerability Mmio stale data: Not affected
Vulnerability Retbleed: Not affected
Vulnerability Spec store bypass: Vulnerable
Vulnerability Spectre v1: Mitigation; __user pointer sanitization
Vulnerability Spectre v2: Vulnerable
Vulnerability Srbds: Not affected
Vulnerability Tsx async abort: Not affected
SoC guess: NXP LS1028A / guess flawed since running in vmware
Compiler: /usr/bin/gcc (Debian 12.3.0-4) 12.3.0 / aarch64-linux-gnu
Userland: arm64
Kernel: 6.3.0-1-arm64/aarch64 (vmware)
CONFIG_HZ=250
CONFIG_HZ_250=y
CONFIG_PREEMPT_NOTIFIERS=y
CONFIG_PREEMPT_VOLUNTARY=y
CONFIG_PREEMPT_VOLUNTARY_BUILD=y
##########################################################################
Results validation:
* No swapping
* Throttling occured
Status of performance related policies found below /sys:
* /sys/module/pcie_aspm/parameters/policy: [default] performance powersave powersupersave
| VMware Cortex-A72 VM | ~2000 MHz | 6.3 | Debian GNU/Linux trixie/sid arm64 | 3380 | 1798 | 40000 | 2420 | 3240 | - |
```
| compressed |
|
| raw (vm) | 136 GB |
| vol (hypervisor) | 136 GB (no compression as data already compressed) |
| zvol (hypervisor) | 103,4 GB (light deduplication) |
| uncompressed |
|
| raw (vm) | 297 GB |
| vol (hypervisor) | 248 GB (hv compression) |
| zvol (hypervisor) | 59,7 GB (massive deduplication) |
# Kubernetes
# Plex Media Server - Volume Mounting
Reference: [https://www.plex.tv/blog/plex-pro-week-23-a-z-on-k8s-for-plex-media-server/](https://www.plex.tv/blog/plex-pro-week-23-a-z-on-k8s-for-plex-media-server/)
Reference: [https://github.com/plexinc/pms-docker/tree/master/charts/plex-media-server](https://github.com/plexinc/pms-docker/tree/master/charts/plex-media-server)
Mounting CIFS Volume to PMS on Kubernetes (values).
```yaml
rclone:
# if the rclone sidecar should be created
enabled: true
# The name of the secret that contains the rclone configuration file.
# The key must be called `rclone.conf` in the secret
configSecret: "plex-rconf"
# the remote drive that should be mounted using rclone
# this must be in the form of `name:[/optional/path]`
# this remote will be mounted at `/data/name` in the PMS container
remotes:
- video:/video
# if the remote volumes should be mounted as read only
readOnly: true
```
rclone.conf must be a secret in the following format (anonymous access):
```yaml
apiVersion: v1
kind: Secret
metadata:
name: plex-rconf
type: Opaque
stringData:
rclone.conf: |
[video]
type = smb
host = 10.10.10.10
user = guest
```
Effectivly mounting \\\\10.10.10.10\\video
# k3s - Multiple network interfaces
k3s will pick the first address it finds as node ip.
Adding --flannel-iface and/or --node-ip will allow to configure the addresses.
Reference: [https://docs.k3s.io/cli/server](https://docs.k3s.io/cli/server)
Removing gateway from all interfaces except one will be choosen as default route.
# Plex Media Server - iGPU Mounting
/dev/dri mounted through container for iGPU usage
```yaml
# Optionally specify additional volume mounts for the PMS and init containers.
extraVolumeMounts:
- name: dev-dri
mountPath: /dev/dri
# extraVolumeMounts:
# - name: some-volume-name
# mountPath: /path/in/container
# Optionally specify additional volumes for the pod.
extraVolumes:
- name: dev-dri
hostPath:
path: /dev/dri
# extraVolumes:
# - name: some-volume-name
# emptyDir: {}
```
Reference: [https://github.com/plexinc/pms-docker/tree/master/charts/plex-media-server](https://github.com/plexinc/pms-docker/tree/master/charts/plex-media-server)
# k3s increase inotify
When you encounter the following error on k3s/k8s:
```json
{"component":"virt-handler","level":"fatal","msg":"Failed to create an inotify watcher","pos":"cert-manager.go:105","reason":"too many open files","timestamp":"2025-08-19T21:31:37.405064Z"}
```
You may increase the following value fs.inotify.max\_user\_instances = 8192. It defaults to 128 on Debian 13. You may check fs.inotify.max\_user\_watches as well. However its handled dynamically in most cases.
```bash
sysctl -w fs.inotify.max_user_instances=8192
```
Its recommended to make it persistent by creating a file in /etc/systctl.d/.